Blog
January 9, 2019

Prometheus monitoring can be tricky. In part one of this blog series, we look at how to import data from your Java application, set up Prometheus Exporters like the JMX Exporter, configure Prometheus to call for that data, and how to validate once these steps are complete.
In parts two and three, we look at how to connect Prometheus with Grafana to visualize the data in a dashboard, then how to configure alerts via the Prometheus AlertManager.
Ready to get started? Click a link below to jump to your desired section, or keep reading for a quick overview of Prometheus.
What Is Prometheus Monitoring?
Back to topPrometheus is a monitoring tool. Prometheus is a powerful and popular open source time series tool and database. It stores and exposes metrics and statistics. It was originally used to monitor containers running within Kubernetes, but quickly evolved into a flexible, enterprise-ready monitoring solution.
How Do I Export My Data From Prometheus?
Here's how to export your data from Prometheus.
1. Understand Prometheus Architecture
First, gather metrics that aren’t generated within a Kubernetes clustering environment.
Let’s take a quick look at Prometheus’ architecture. Here, we're looking at Java application performance monitoring (APM):
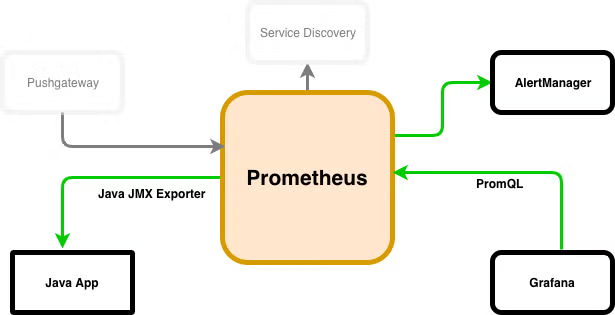
Prometheus can gather metrics in several different ways. Batch jobs and ephemeral workload applications can push metrics into Prometheus. This is done using its Pushgateway. Prometheus can also discover new metrics running inside of supported environments like Kubernetes. This is done by using its Service Discovery mechanisms.
It can also pull metrics from Prometheus exporters, which is what we’ll be doing. Alerts can be triggered via the AlertManager. This can interact with downstream systems like PagerDuty. And visualization engines like Grafana can query data out of Prometheus and display it.
Back to topWhat Are Prometheus Exporters?
Prometheus Exporters are used to export data metrics from Prometheus. You'll need to download and install a Prometheus exporter in order to pull metrics.
There are different types of Prometheus exporters you can use. Here, we'll focus on JMX Exporter.
Back to topWhat Is JMX Exporter?
JMX Exporter is a Java-native specification. It allows developers to expose a Java application’s metrics, statistics, and basic operations in a standard way from Prometheus.
Here, we’ll use a special type of Prometheus exporter called a JMX (Java Management Extensions) Exporter. The Prometheus JMX Exporter exposes a Java application’s JMX objects in a way that is friendly for Prometheus to consume.
A Java application can create JMX objects (called mBeans or Management Beans). These can store data or give access to application operations. Some of these objects are standard to the JVM. Others are specific to a particular application.
For instance, here’s a common JMX introspection tool called JConsole. This tool ships with most variants of the Java JDK.
Here, it is browsing objects in a running instance of ActiveMQ:
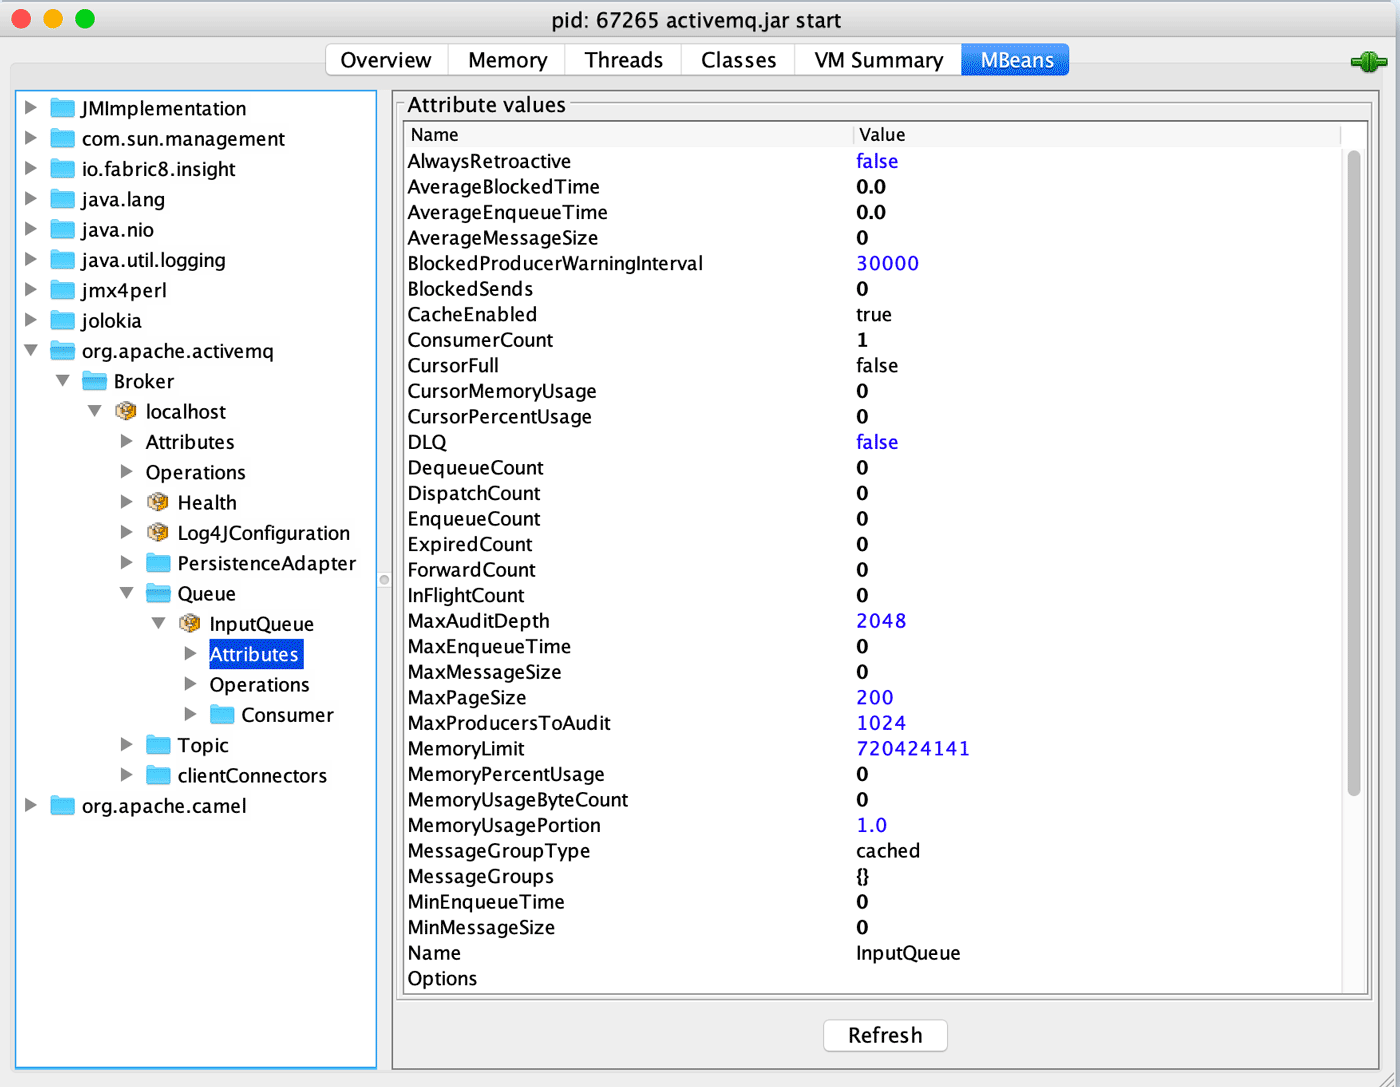
Well-constructed Java applications will expose lots of relevant and helpful metrics. These are meant to be consumed by monitoring solutions like Prometheus.
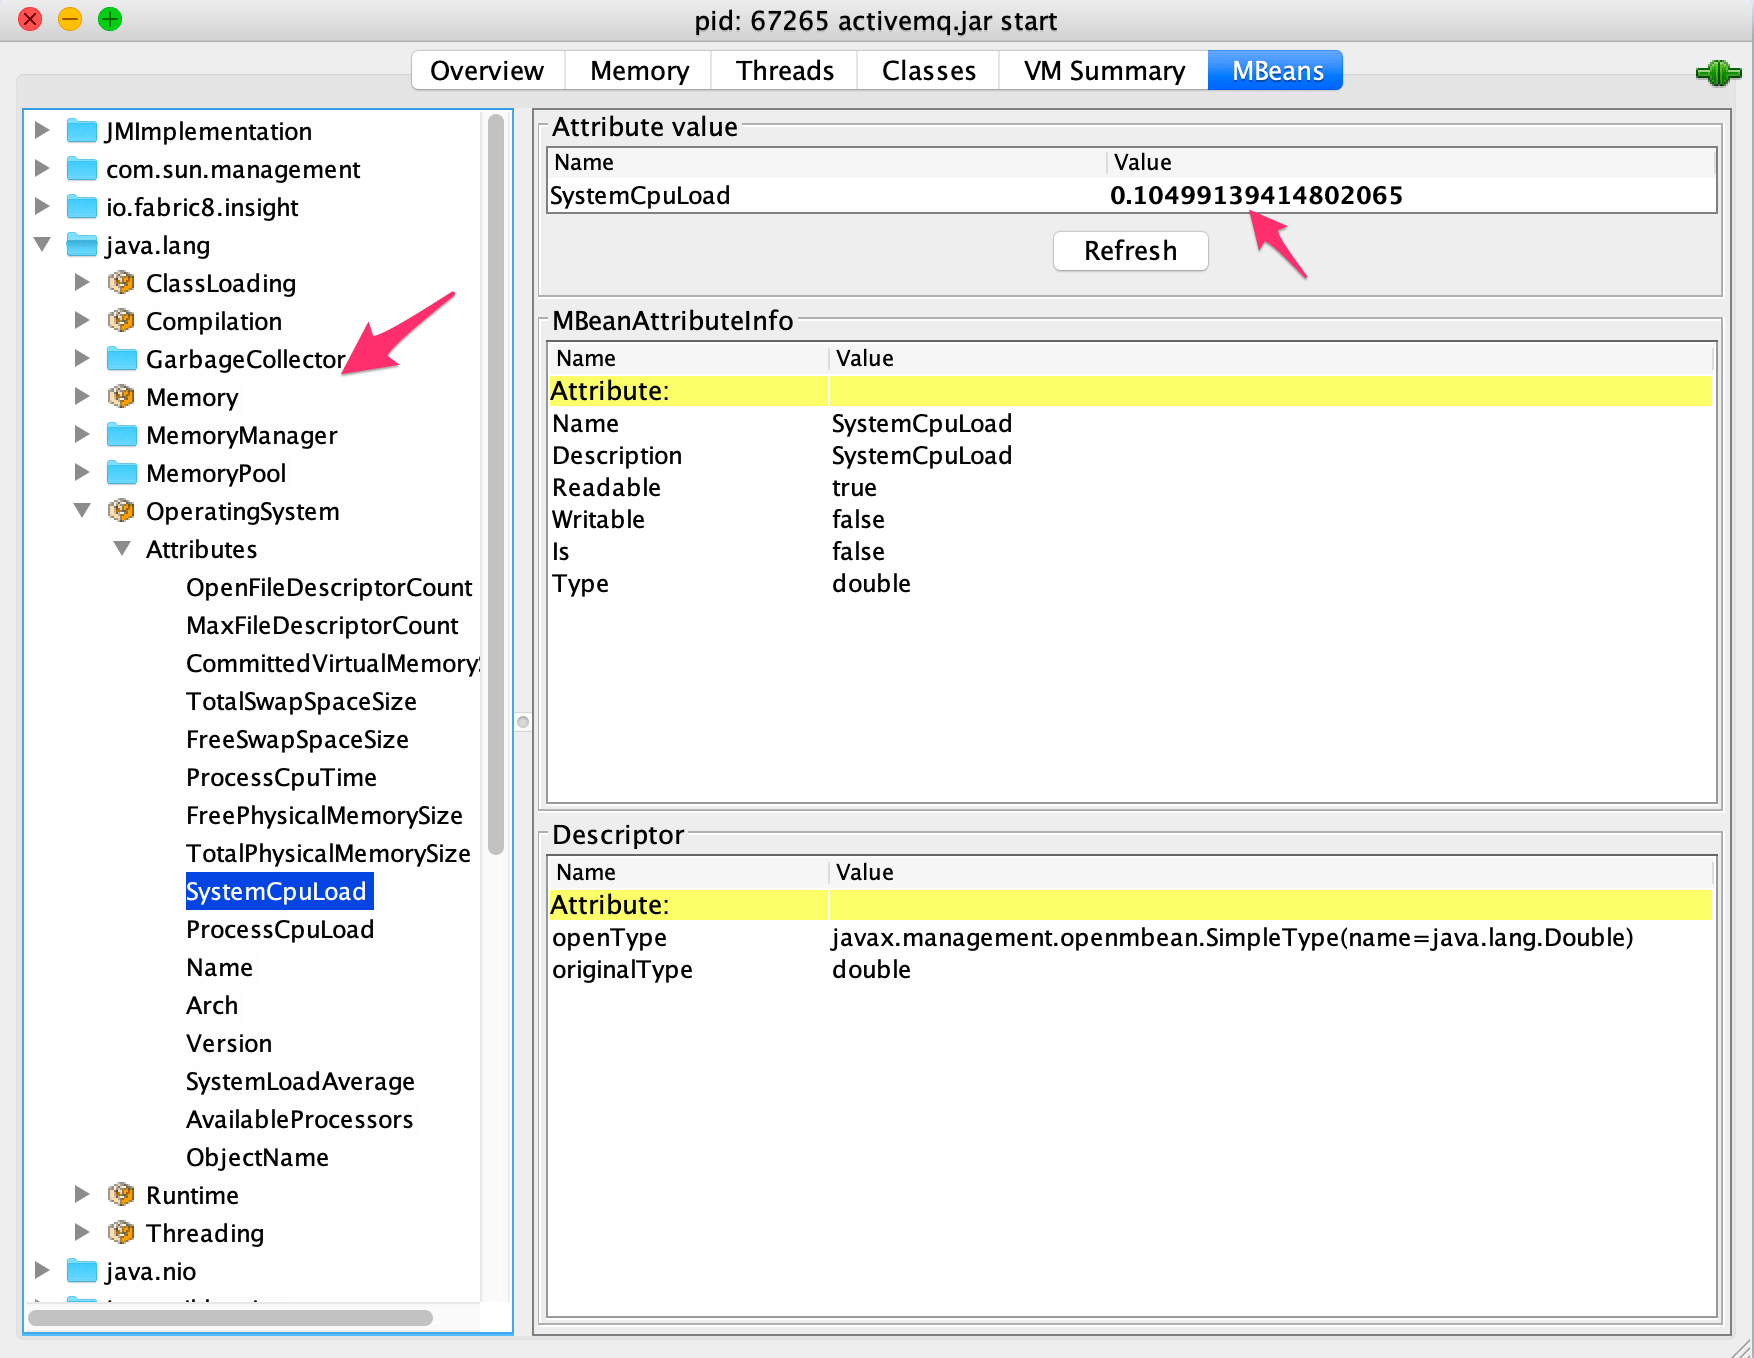
Most enterprise-class monitoring solutions will support gathering JMX metrics. This is considered a standard and practical way to gather data about running Java applications. JMX can also provide useful insight into the health of the JVM, by inspecting the mBeans inside of java.lang:
So, as you can see, there’s plenty of delicious monitoring data just waiting to be consumed!
Back to topHow to Install Prometheus Exporter and Configure the JMX Exporter
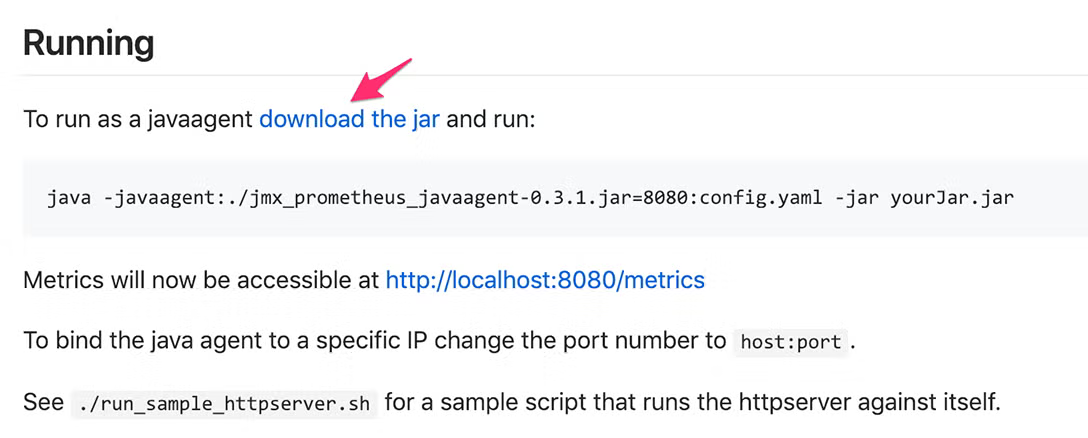
1. Download the Java JMX Exporter jar
There are two distributions available. I find that the native JMX Java Agent is the easiest to work with, but there is also a “standalone” HTTP JMX Exporter available. We’ll use the Java Agent in this post. Head here and click the “Download Jar” link:
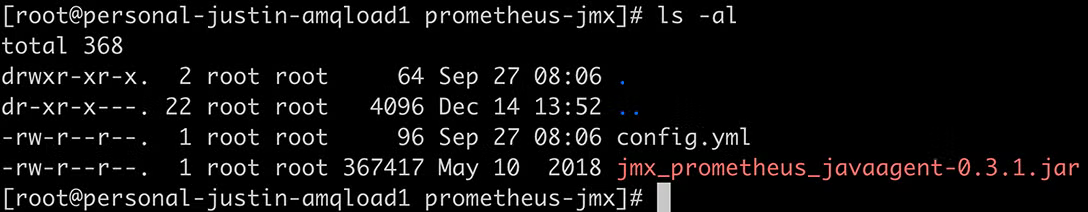
2. Get the .jar File Accessible to Java
Place the downloaded .jar file somewhere accessible to the Java application. If you want to reuse the agent for multiple Java applications running on the same instance, you can place it in a common area.
In my case, I’ve just dropped it in the bin directory of ActiveMQ, but it really doesn’t matter where you place it. For this demo (on a test machine – don’t do this with root in real life), I’ve just dropped it into its own directory called /root/prometheus-jmx:
3. Configure the config.yml file for our Application
In our case, we’ll use a very basic configuration that will expose all metrics. But this file can be used to provide fine-grained control over which mBeans are exported. It can also configure HTTPS:
[root@personal-justin-amqload1 prometheus-jmx]# cat config.yml
---
startDelaySeconds: 0
ssl: false
lowercaseOutputName: false
lowercaseOutputLabelNames: false
4. Save the config.yml file
Save the config.yml file somewhere convenient, I’ve just put it in the same directory as the .jar as you can see above.
5. Add a JVM Parameter
Now you’ll need to add a JVM parameter to the Java application itself, requesting that it load the agent on application startup. Normally, a Java application will have a configuration file for specifying JVM parameters. In the case of ActiveMQ, that is the /bin/env file. Add the following parameter:
-javaagent:/path/to/jmx_exporter_jar/jmx_prometheus_javaagent-0.3.1.jar=[HTTP PORT]:/path/to/jmx_exporter_config/config.yml
For instance, in ActiveMQ’s env file, I’ve updated the variable that will be passed into the app as a JVM parameter:
ACTIVEMQ_OPTS="$ACTIVEMQ_OPTS_MEMORY -javaagent:/root/prometheus-jmx/jmx_prometheus_javaagent-0.3.1.jar=8080:/root/prometheus-jmx/config.yml -Djava.util.logging.config.file=logging.properties -Djava.security.auth.login.config=$ACTIVEMQ_CONF/login.config"
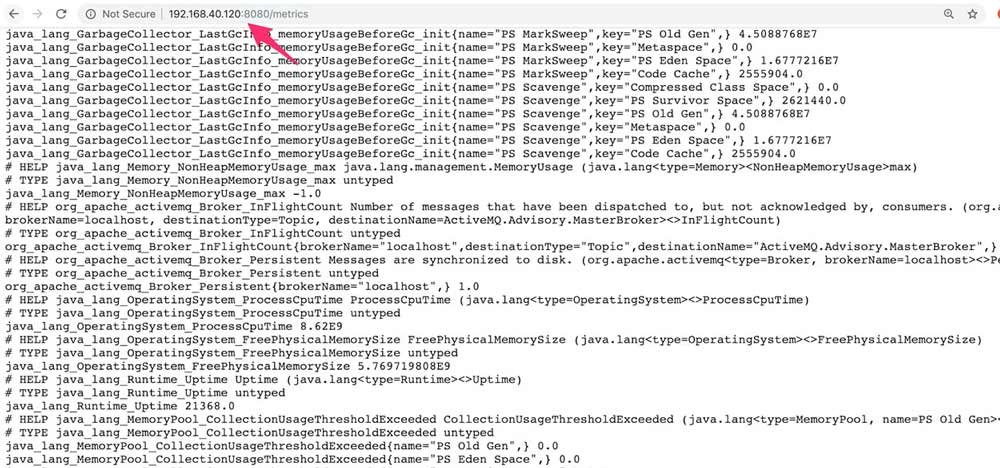
That’s it! Fire up your Java application as normal, and verify that you can see metrics being exposed in a simple text format when you visit http://[HOSTNAME]:[HTTP_PORT]/metrics:
Back to topSupport For Prometheus Monitoring For Java
Our experts are skilled in Prometheus, Grafana, and many other analytics solutions. Find out how our open source experts can help you get the most out of your data analytics solutions.
How to Configure Prometheus
Configuring Prometheus to collect data at set intervals is easy. Here's how you do it:
1. Download and Extract Prometheus
If you haven’t already downloaded Prometheus, do so and extract it.
2. Create New config file
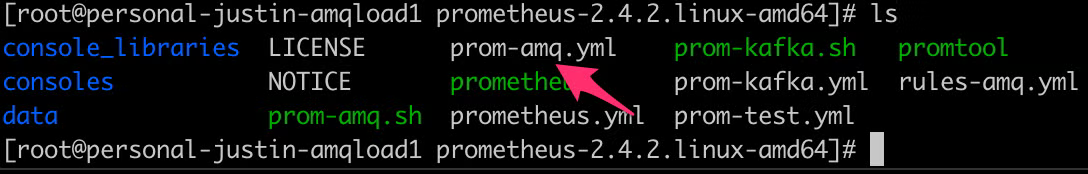
We’ll need to create a new config file (or add new tasks to an existing one). We’ll create a file called prom-amq.yml and place it in Prometheus’s root directory (though you can place yours anywhere):
Here’s a sample configuration file:
global:
  scrape_interval:     15s
  external_labels:
    monitor: 'activemq'

scrape_configs:
  - job_name: 'activemq'
    scrape_interval: 5s
    static_configs:
      - targets: [localhost:8080']
3. Set a Global scrape_interval
Seta global scrape_interval (a global amount of time between Prometheus gathering data from this source) in global settings. Configure a label called “monitor” named “activemq”.
Under “scrape_configs”, create a job_name called “activemq”, override the global “scrape_interval” for this job to 5 seconds. Tell Prometheus to hit “[hostname]:8080” for the data. This will correspond to the hostname and port that you configured in the JMX Exporter config.
Launch Prometheus, passing in the configuration file as a parameter, by running the following command:
./prometheus --config.file=prom-amq.yml
How to Validate Java Monitoring
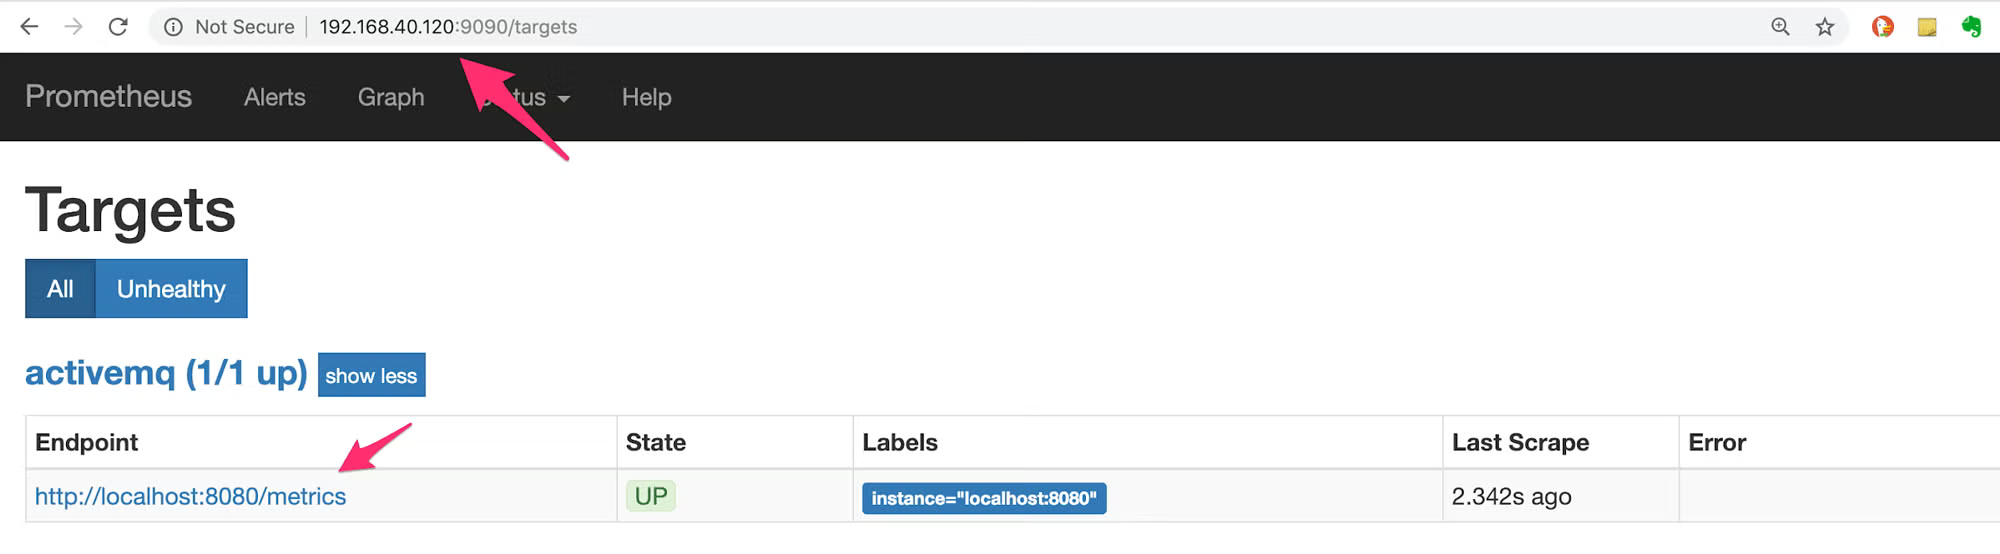
1. Validate the State is Up
At this point, you should have a functional Prometheus instance gathering data from the JMX Exporter. Open Prometheus in a web browser and click Status -> Targets, and validate that the State is Up:
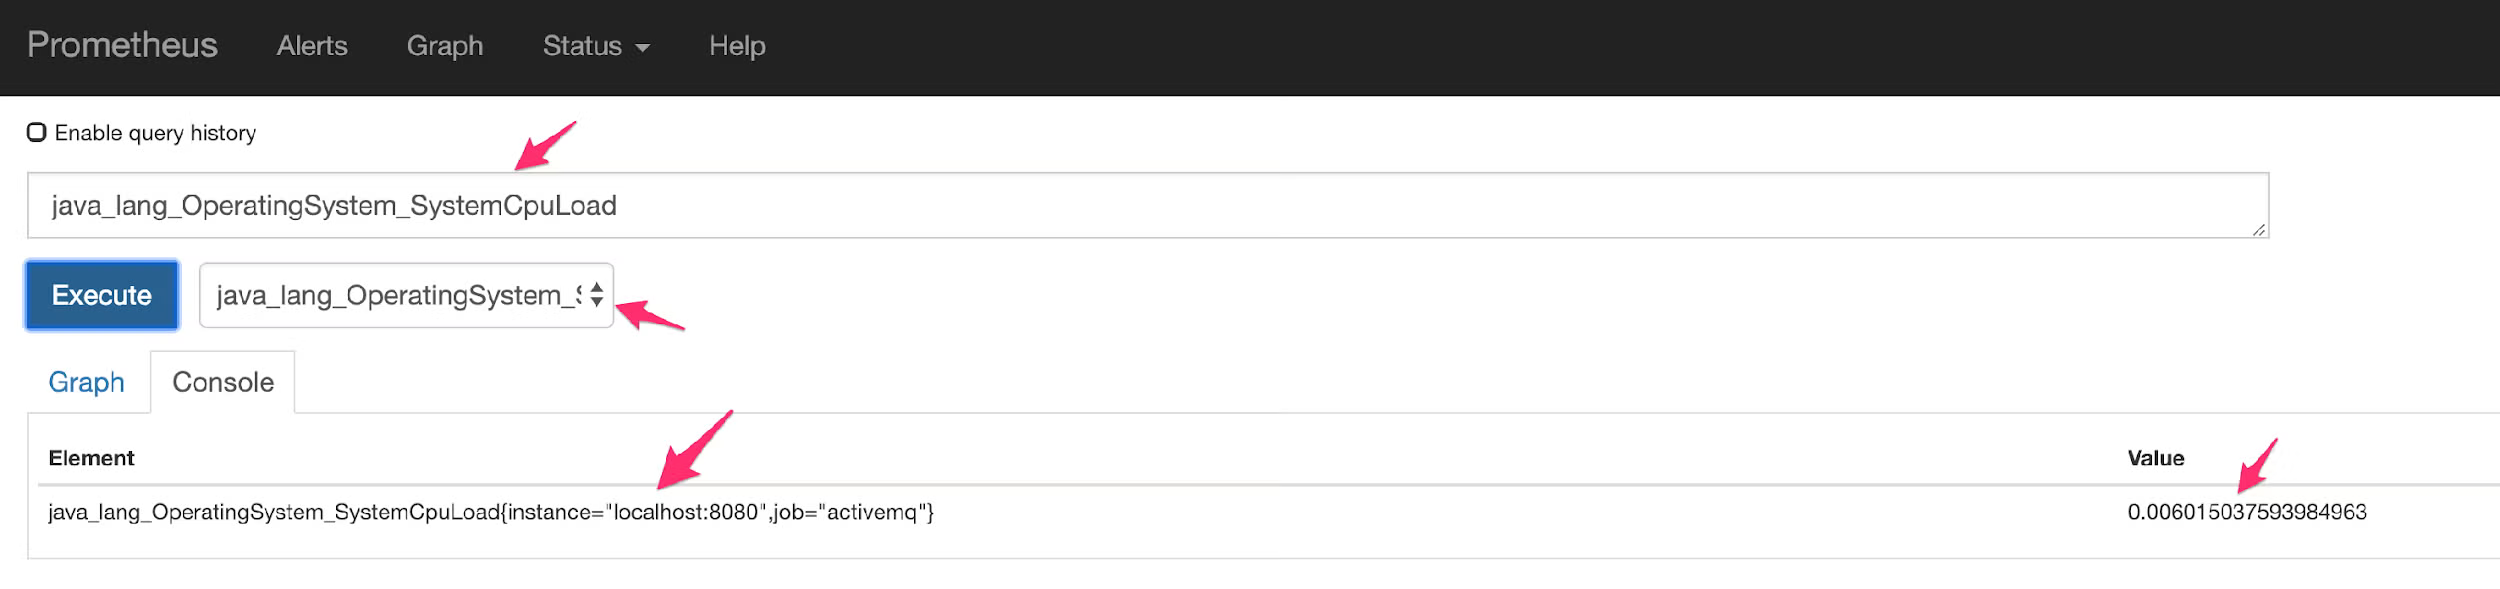
2. Query Data
Query some data and ensure that it matches what you see in the JMX Exporter Output. Click the Prometheus section to return to the main screen, and use the pull-down next to the “Execute” button to select a metric and view its contents:
Additional Resources
- Recorded Webinar - Monitoring Java Applications With Prometheus and Grafana
- Blog - How to Visualize Prometheus Data With Grafana Dashboards
- Blog - Configuring Grafana Alerts and Prometheus Alerts With AlertManager
- Resource Collection – Intro to Open Source Databases