Blog
January 22, 2019

Prometheus and Grafana are growing in popularity. Here, we break down how to visualize Prometheus data with Grafana. And we give you some Prometheus Grafana dashboard examples.
Back to topWhat Is Prometheus and Grafana?
Back to topPrometheus is an open source monitoring and alerting toolkit. Grafana is an open source visualization and analytics software.
How to Use Prometheus Query and Grafana Query
Here's how you can use Prometheus queries and Grafana queries to create strong and visually appealing dashboards.
Although Prometheus can graph data, Grafana provides a full framework for sharing dashboards, creating advanced queries and graphs, and allowing for sharing and reuse of those dashboards.
So that you can go from this:
To this:
Revisiting our architecture diagram from part 1, recall that Grafana can directly query Prometheus to render the data it needs for its dashboard.
Prometheus is a native data store for Grafana, so configuration is very simple. Grafana itself persists data about the dashboards it has saved, but no data is actually held in Grafana. This makes it a very lightweight and portable solution. So, let’s get into it!
First we'll get Grafana up and running — and connected to Prometheus.
1. Find a Server For Grafana
First, find a suitable server for Grafana, preferably a Linux-based server, and download the appropriate distribution and unarchive it. The default config is good enough to get you started, so just execute the server:
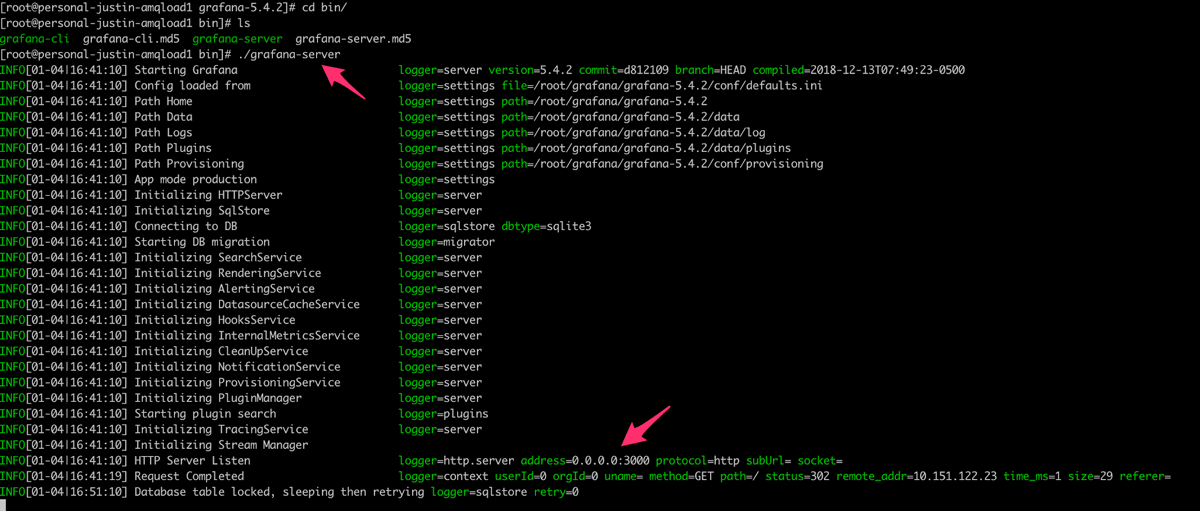
Note that to do this, we just run the grafana-server script from within the /bin directory of the Grafana release.
2. Make the Port Accessible on the Server
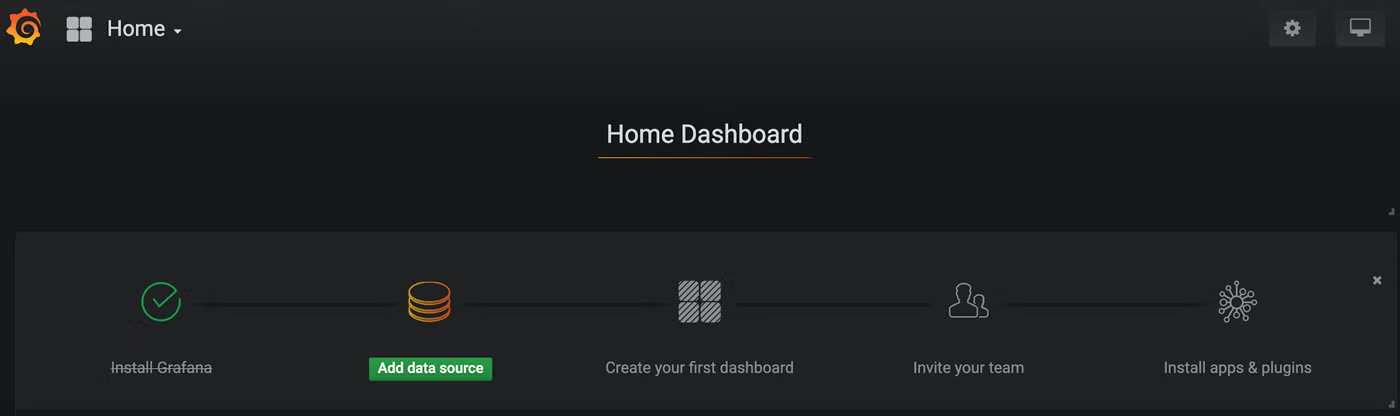
You’ll see that Grafana starts up on port 3000, so make sure that port is accessible on the server and open it up in a web browser by browsing to http://[hostname]:3000. Login with the default credentials (username ‘admin’ and password ‘admin’) and you’ll be greeted with the initialization screen:
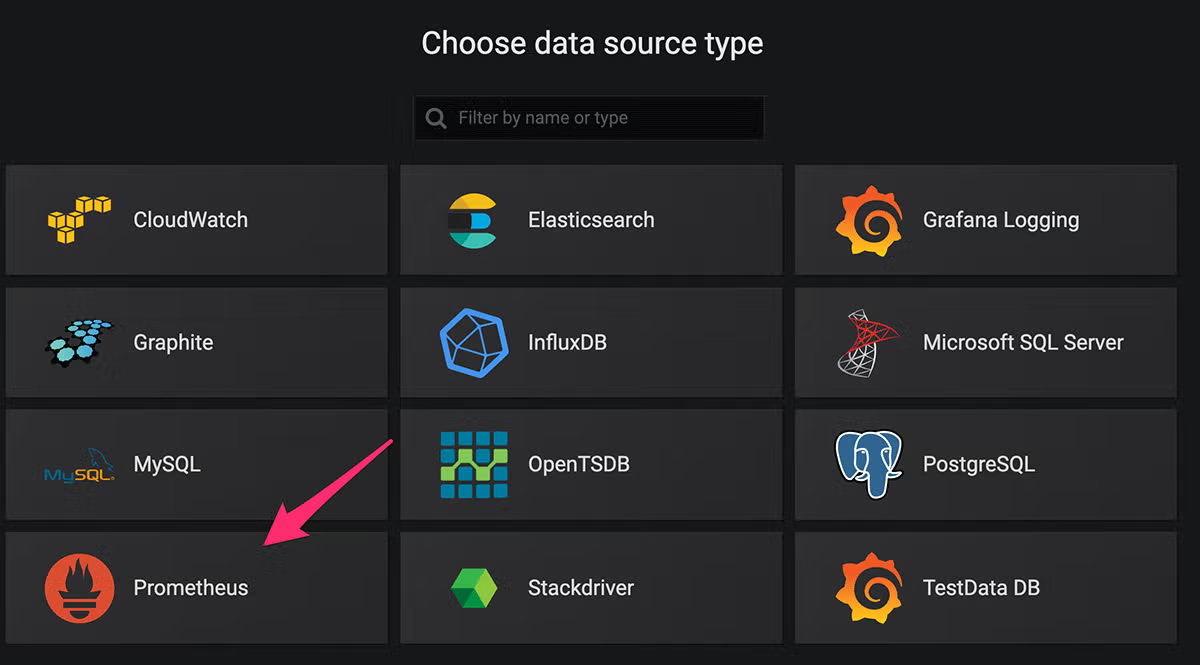
3. Add a Data Source
We need to add a data source, which will be our Prometheus server on port 9090 by default. Click “Add Data Source”, select Prometheus, and add the relevant details:
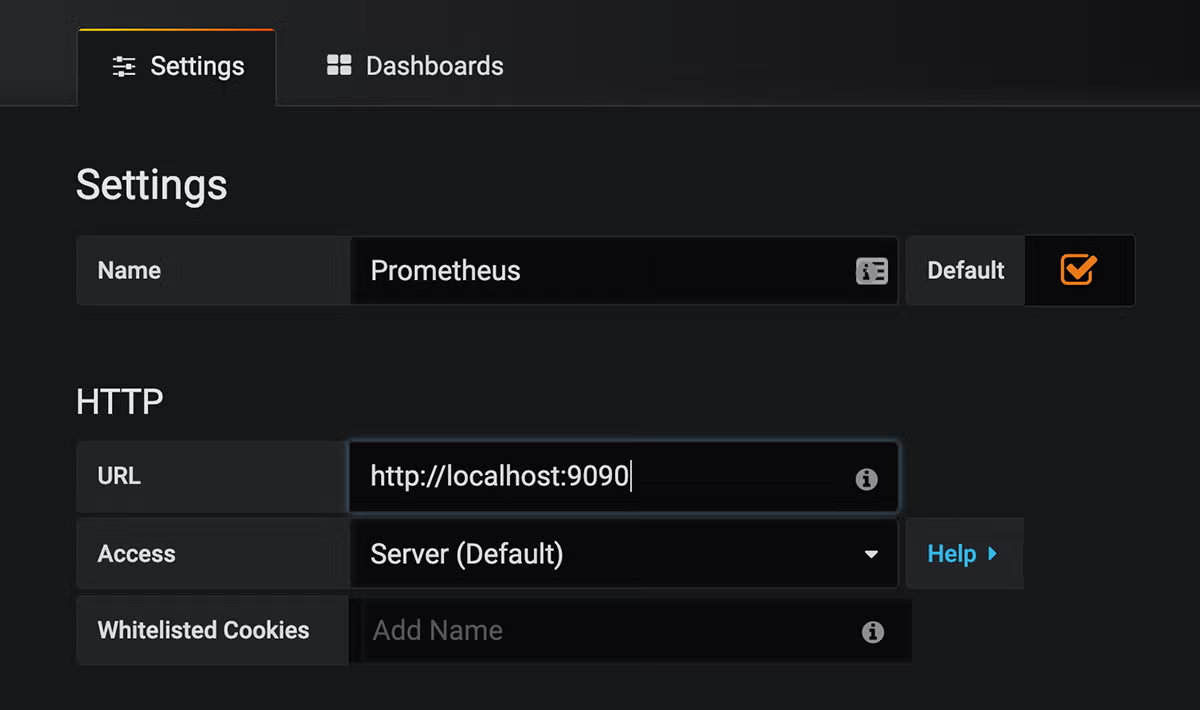
Of course, you’ll replace localhost with the hostname of your Prometheus server. If you need anything else, like authentication for instance, those details can be set up below:
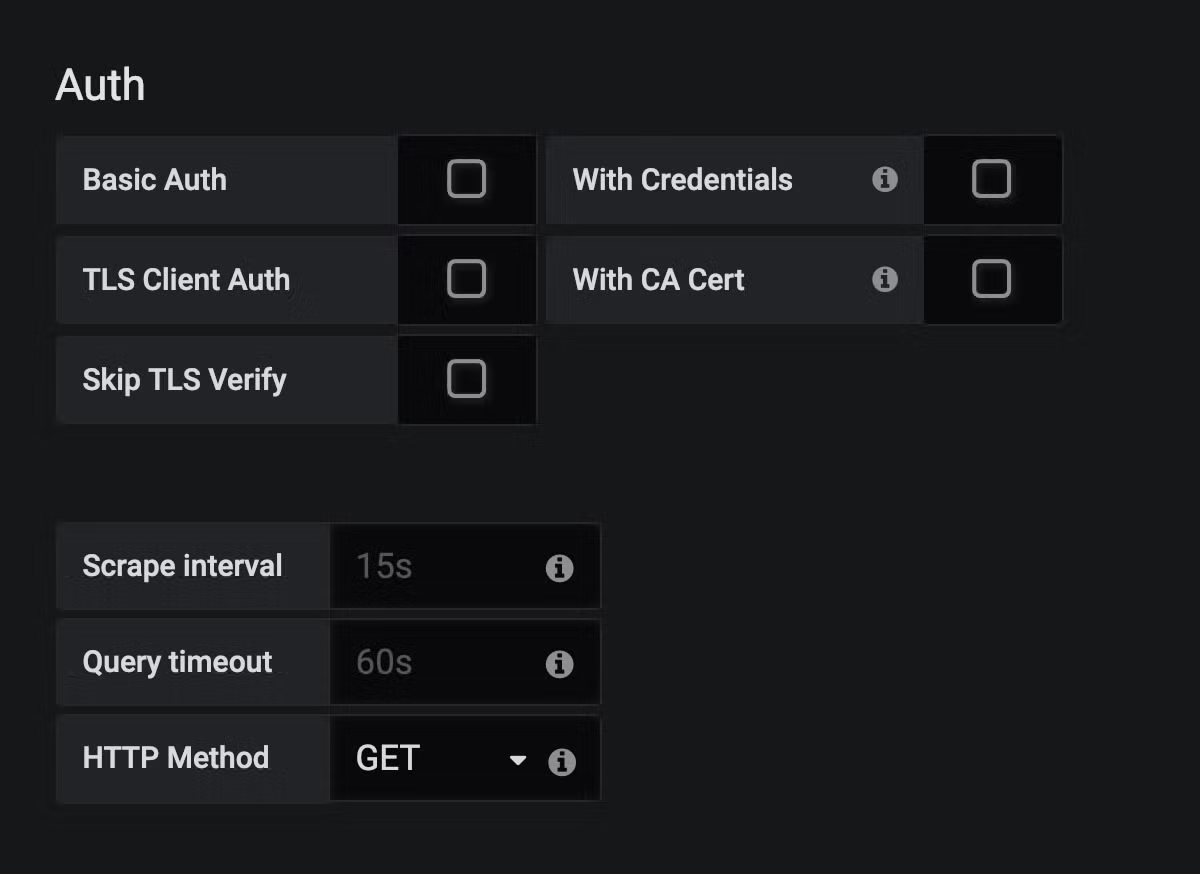
The default values should be fine for what we’ve worked on so far in this blog.
4. Save and Test Prometheus on Grafana
Click Save and Test, and ensure that the connectivity is successful:
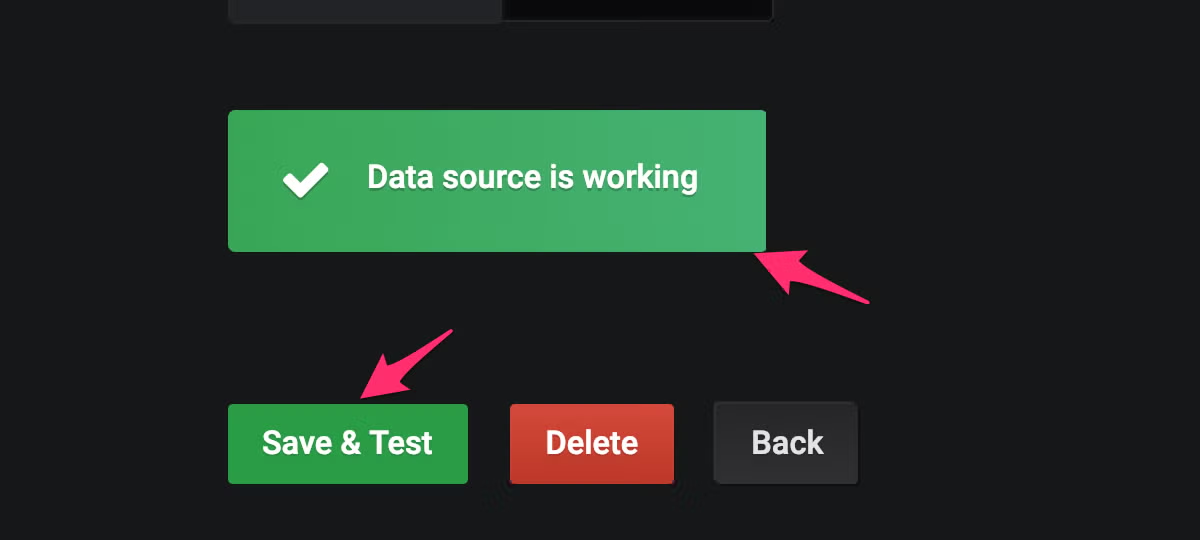
That’s it! Grafana is now capable of querying metrics from Prometheus!
Next, we'll build our panel.
5. Choose the Prometheus Data to Query
Now that we have Grafana gathering metrics, let’s choose some data that we want to query. The easiest way to do this is to find the exact query coordinates using Prometheus, and copy them as a Prometheus query into Grafana.
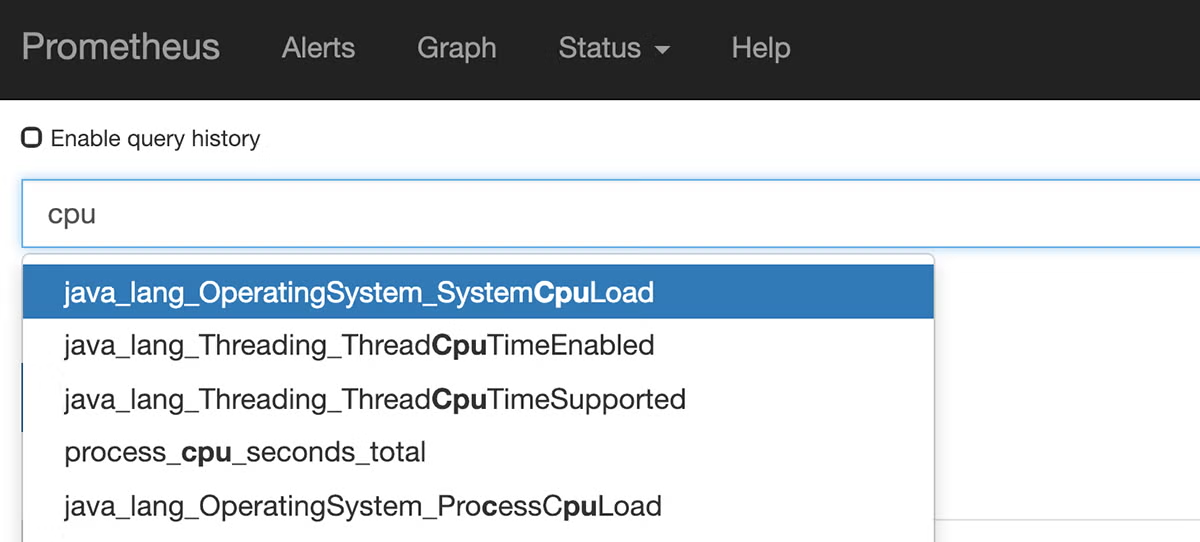
6. Open Prometheus
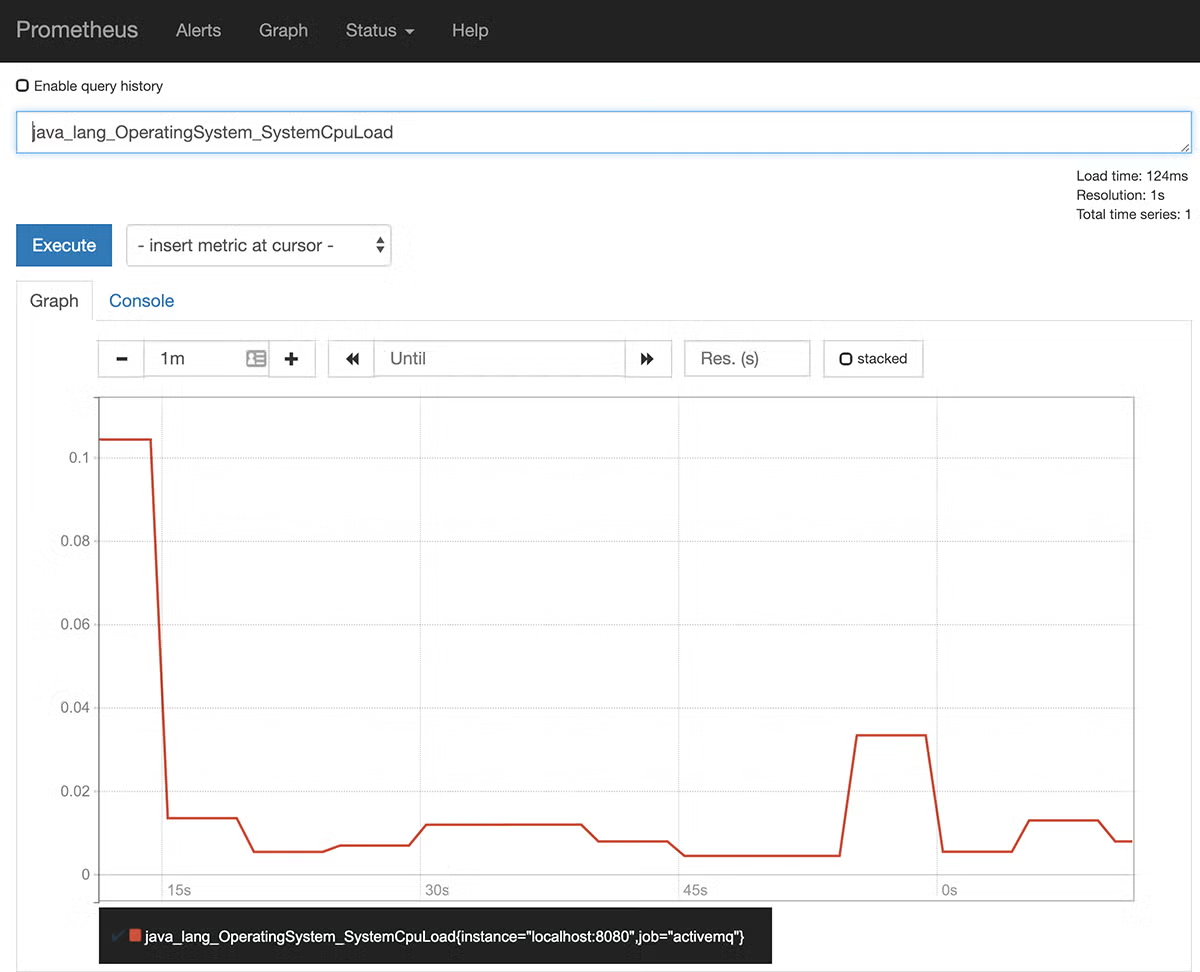
Let’s start with System CPU Load. If we open Prometheus (by default, http://[hostname]:9090, and start typing “cpu” into our Prometheus query, we’ll see that we get some metric labels back:
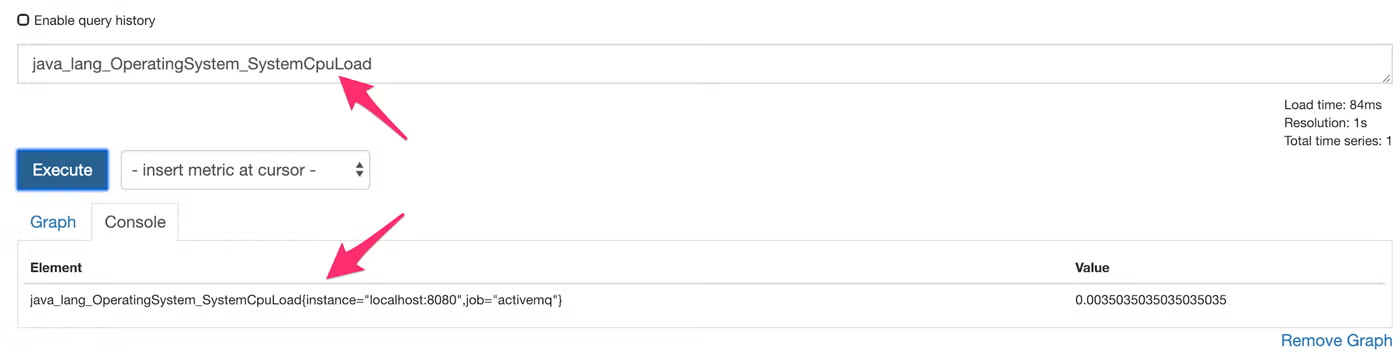
We can select one of those metrics and click Execute to find the full coordinates:
Since there may be multiple metrics, say for instance, Enqueue Time across multiple queues in ActiveMQ, getting the specific coordinate from Prometheus is essential in making sure that we are monitoring the right data. This is better illustrated by looking at a metric like EnqueueCount:
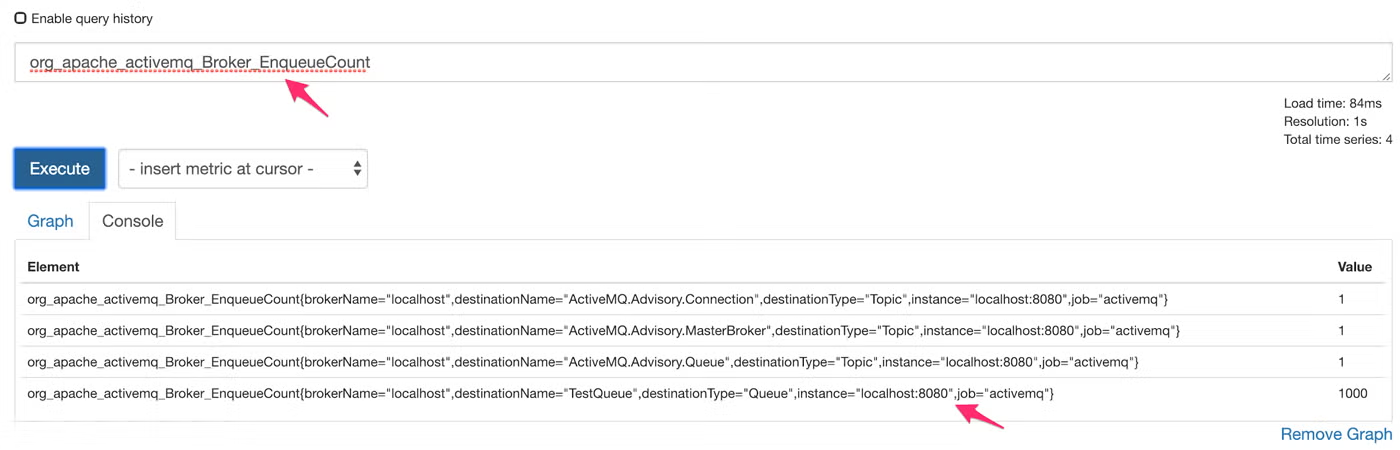
Notice that we have multiple points being gathered across differing “destinationName” objects.
Back to topNeed Open Source Help?
Our open source experts are here to provide technical support and professional services.
Grafana Dashboard Examples: How to Create A Dashboard For Prometheus
Here are some examples of a Prometheus Grafana dashboard.
1. Create a Prometheus Grafana Dashboard
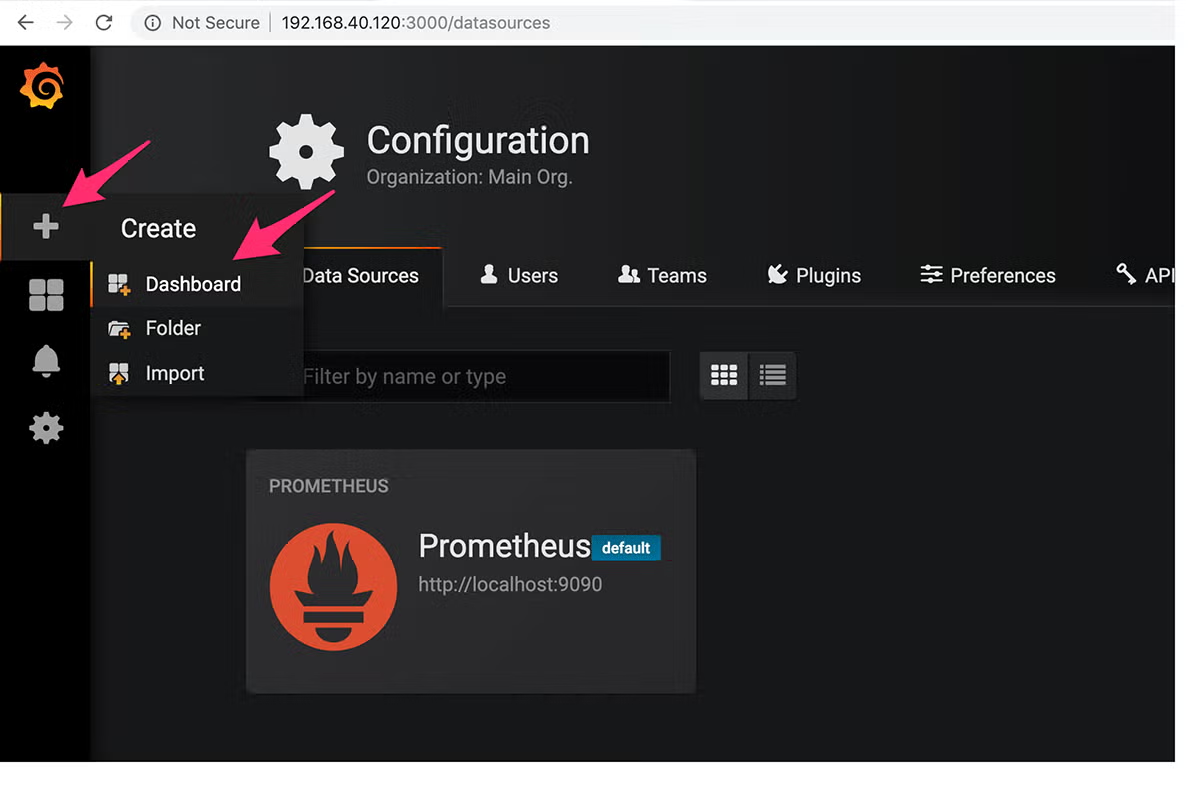
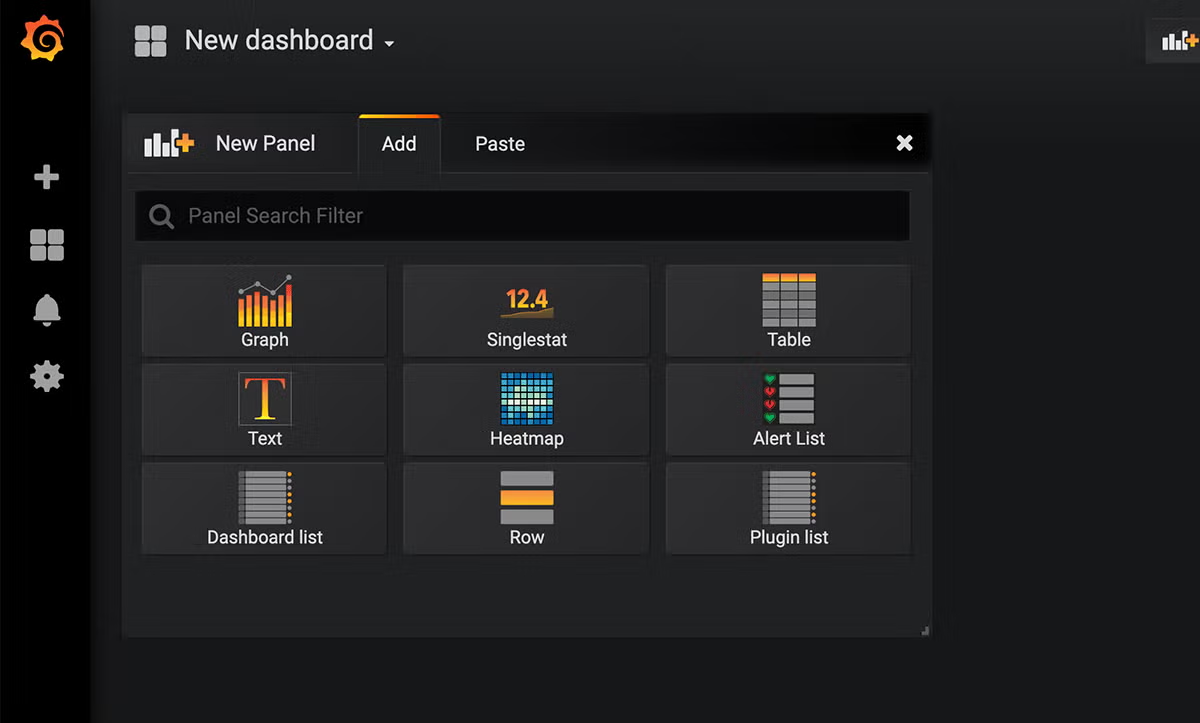
Once we have the right metric coordinates captured, it’s time to create our first Prometheus Grafana dashboard. Click the Grafana Logo to get the side toolbar, and then click “+” followed by “Dashboard”:
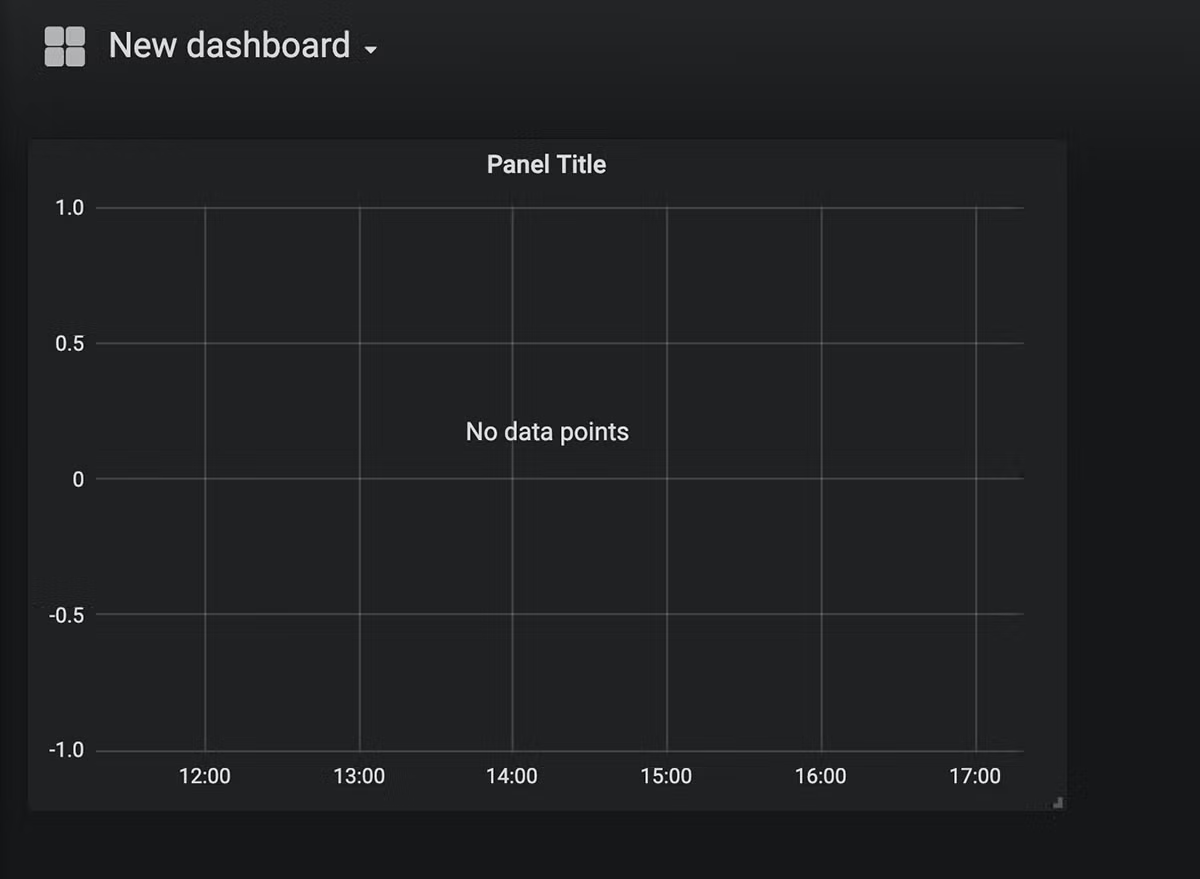
This will create a new dashboard and add our first panel:
2. Configure Your Dashboard For the First Panel
Grafana is arranged into independent panels that can have widgets added to them. These panels can be resized and dragged around the screen. Let’s create a graph of our SystemCPULoad metric. Click “Graph,” and a blank default Graph will be created:
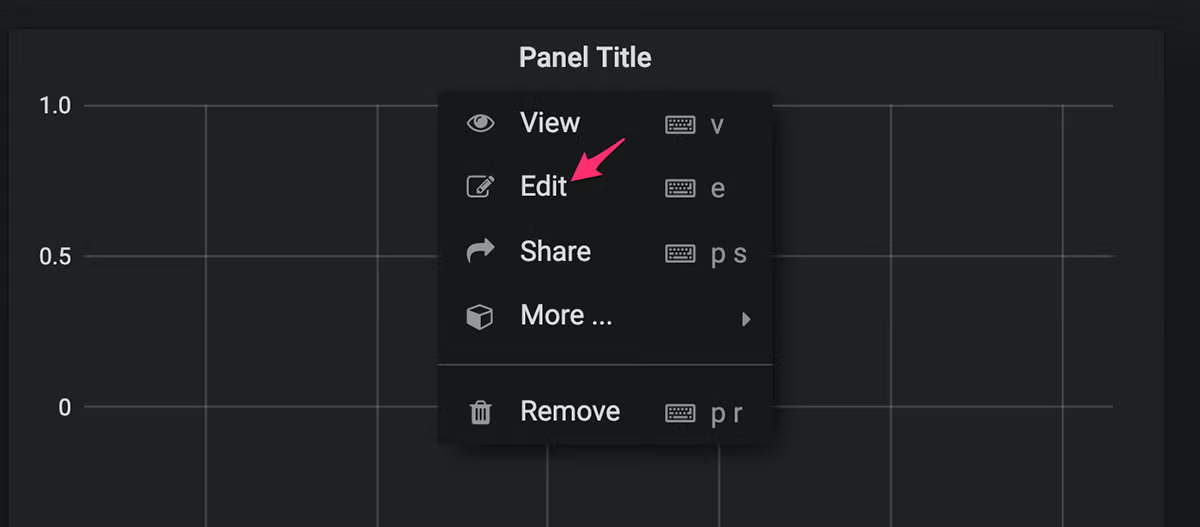
Click the Panel Title to get a toolbar, and then click “Edit”:
This is where we can configure all the details for our graph:
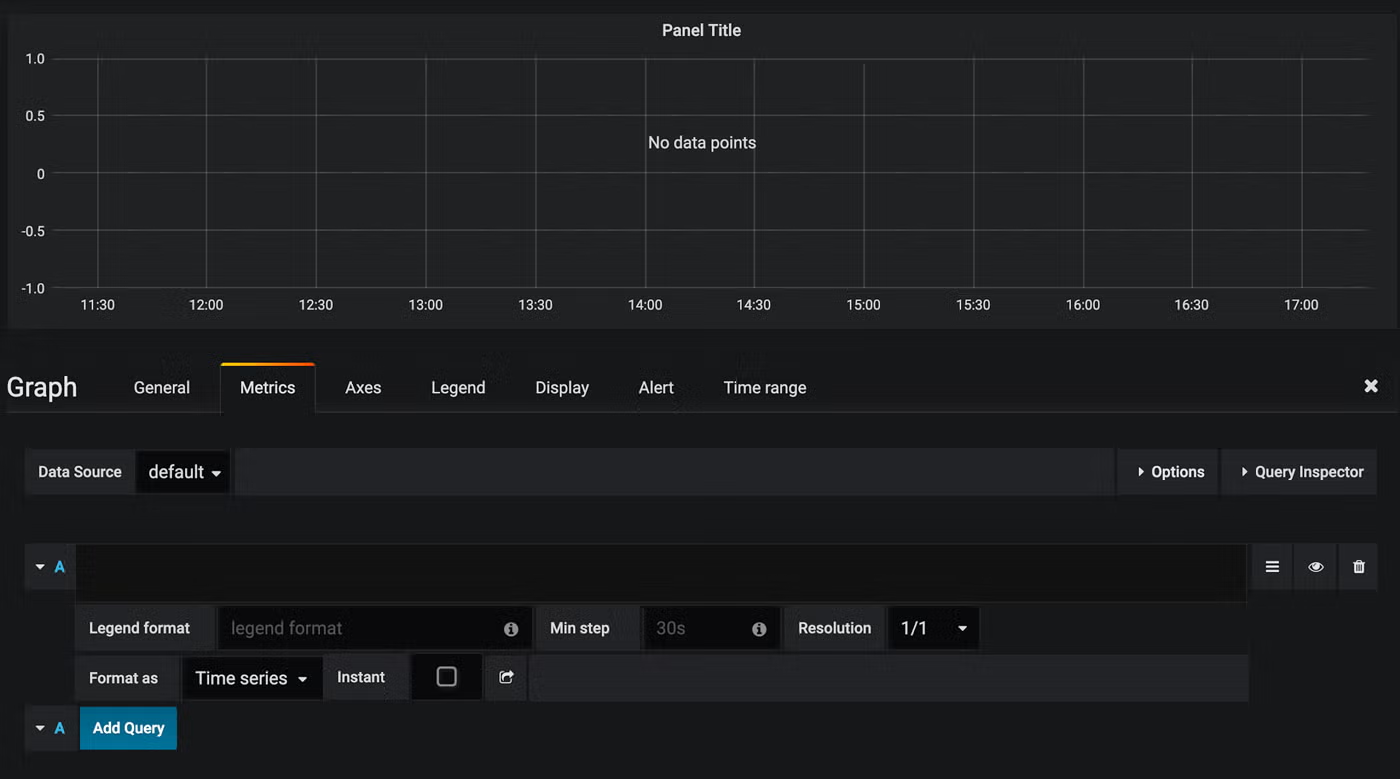
There’s a lot going on in there. For now, copy the SystemCPULoad query that we pulled from Prometheus earlier into the query line:
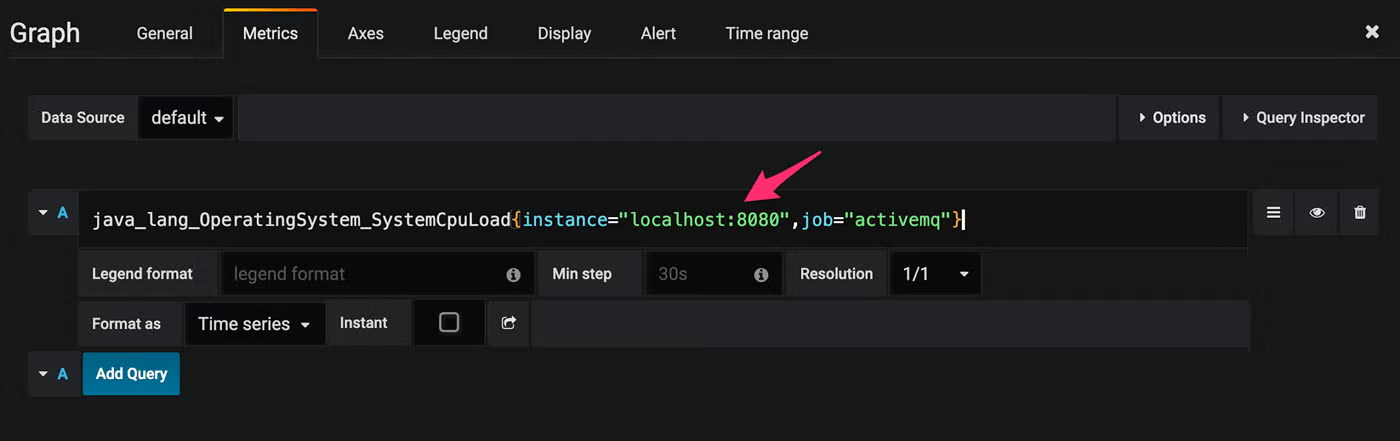
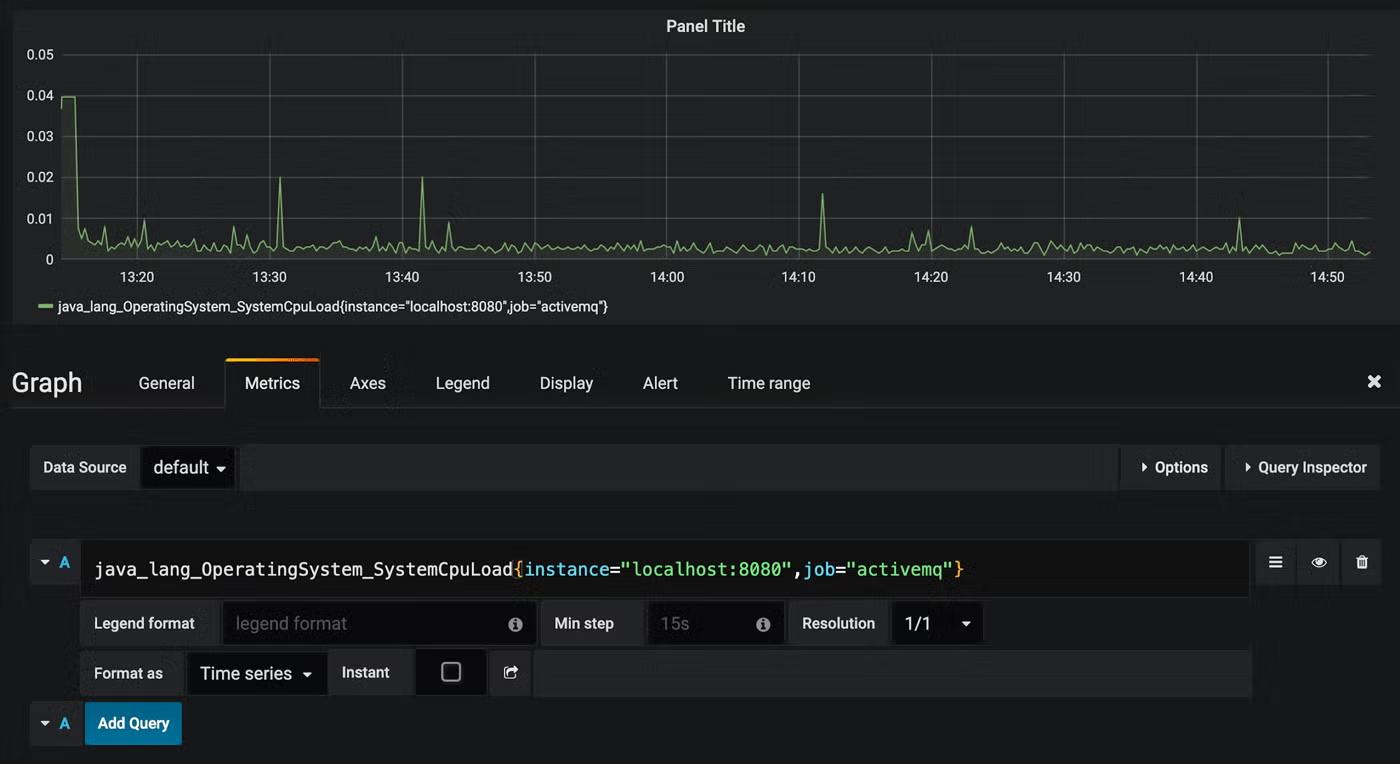
Upon clicking off of the query, you’ll see that Grafana immediately executes the query and starts rendering graph data:
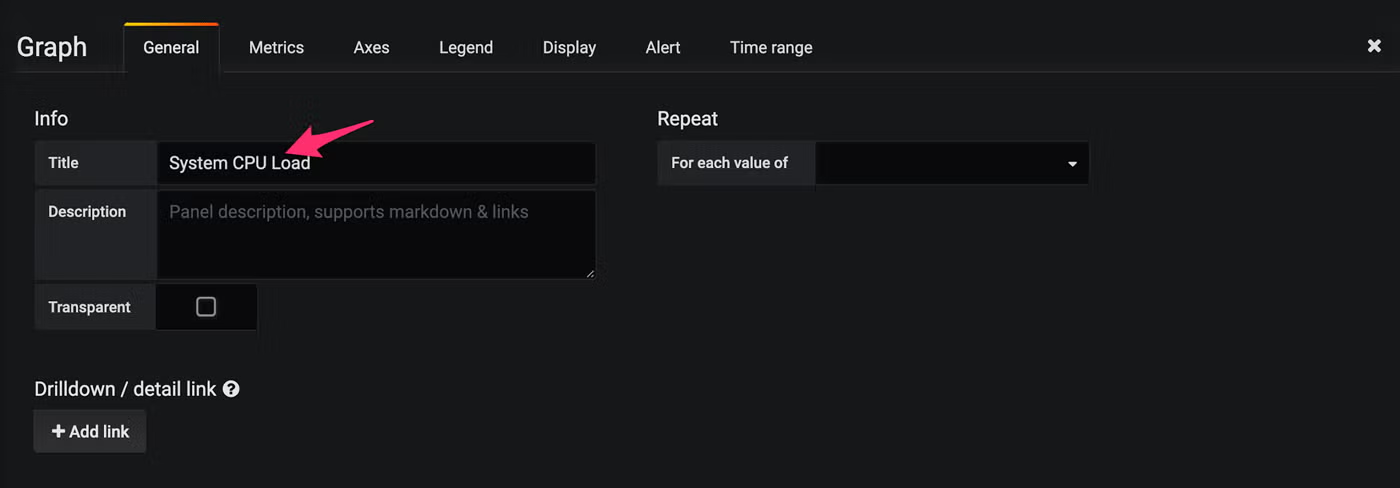
Move to the General tab, and let’s give our Graph a suitable name:
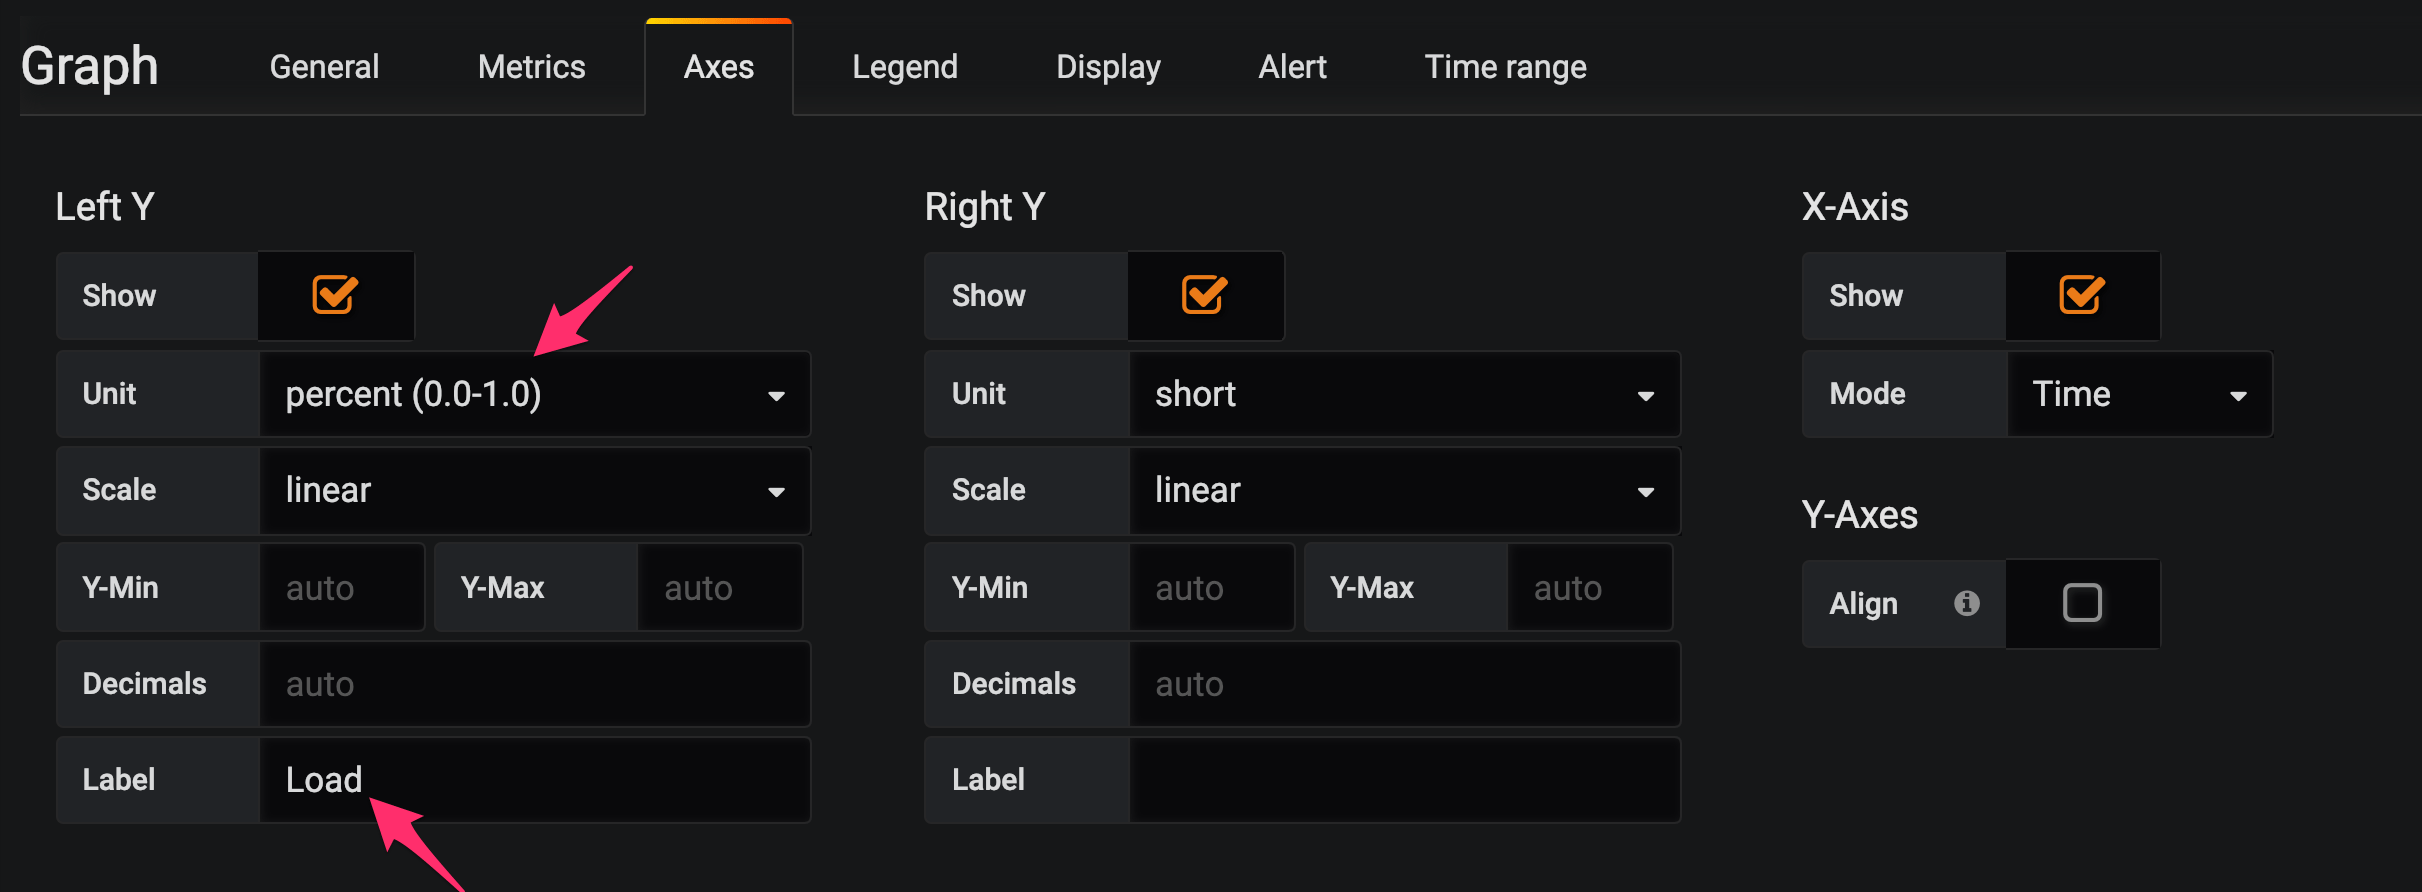
Now let’s label our Y axis and change our number format to Percent(0.0-1.0). Click on the Axes tab and make those updates:
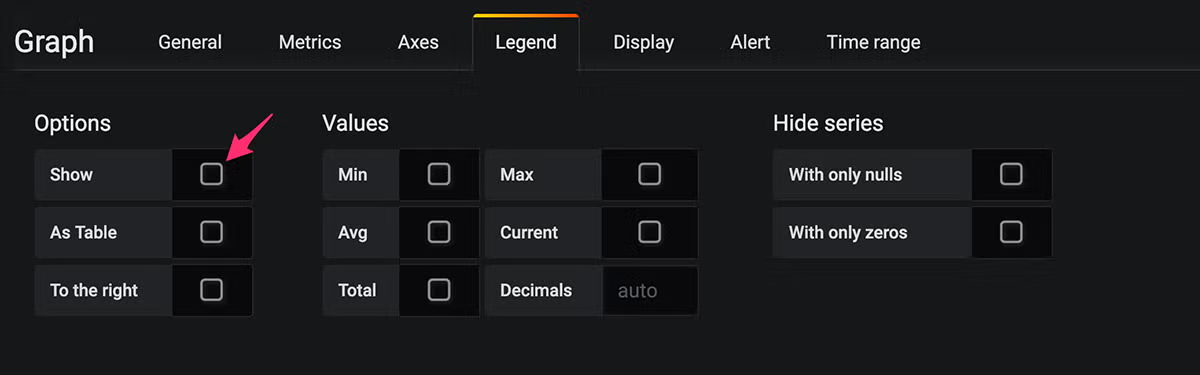
Since we aren’t monitoring multiple metrics in this Graph, we don’t need a Legend, so let’s turn it off via the Legend tab:
That’s it! Click the X to the upper right, and we should see the following finished product as your Grafana Prometheus dashboard example:
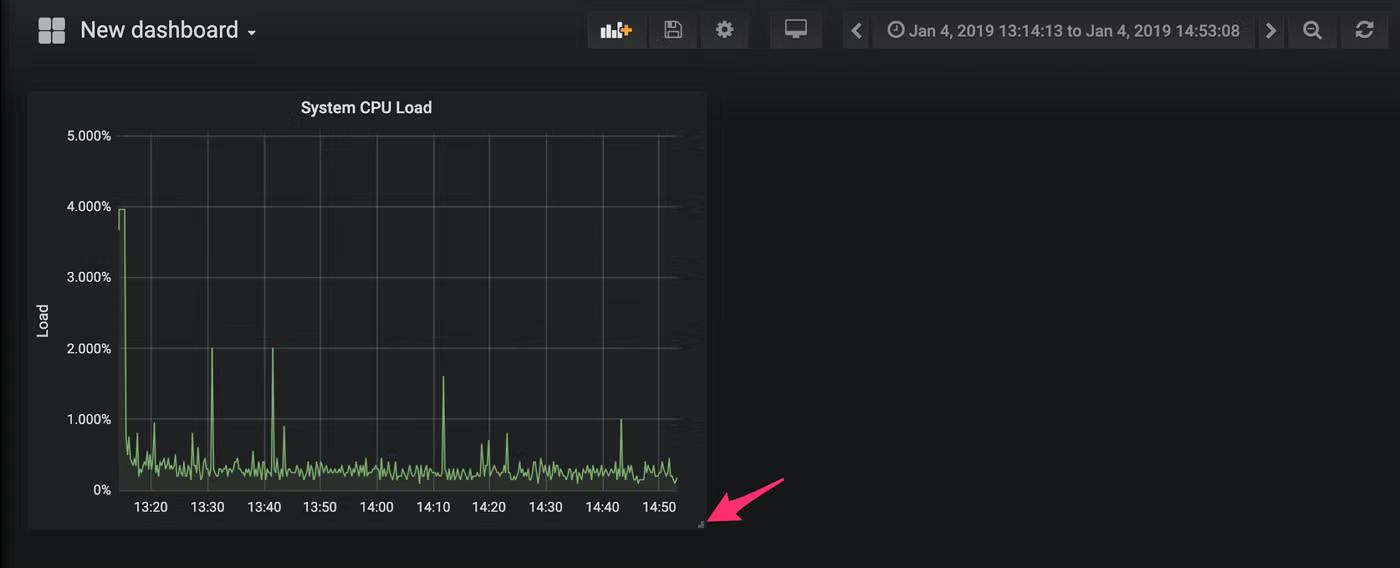
Note that we can resize this graph by using the indicated handle on the lower right of the graph.
Next, we'll show you how to add more metrics.
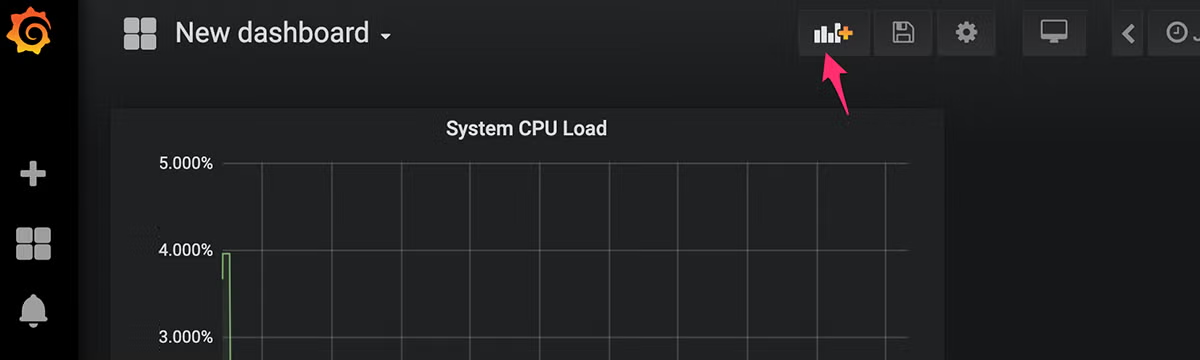
3. Configure Your Dashboard to Monitor More Prometheus Metrics
Great start! But we’ll want to monitor more metrics. Let’s add another Panel for our Enqueue Count metrics. Click the Add Panel button:
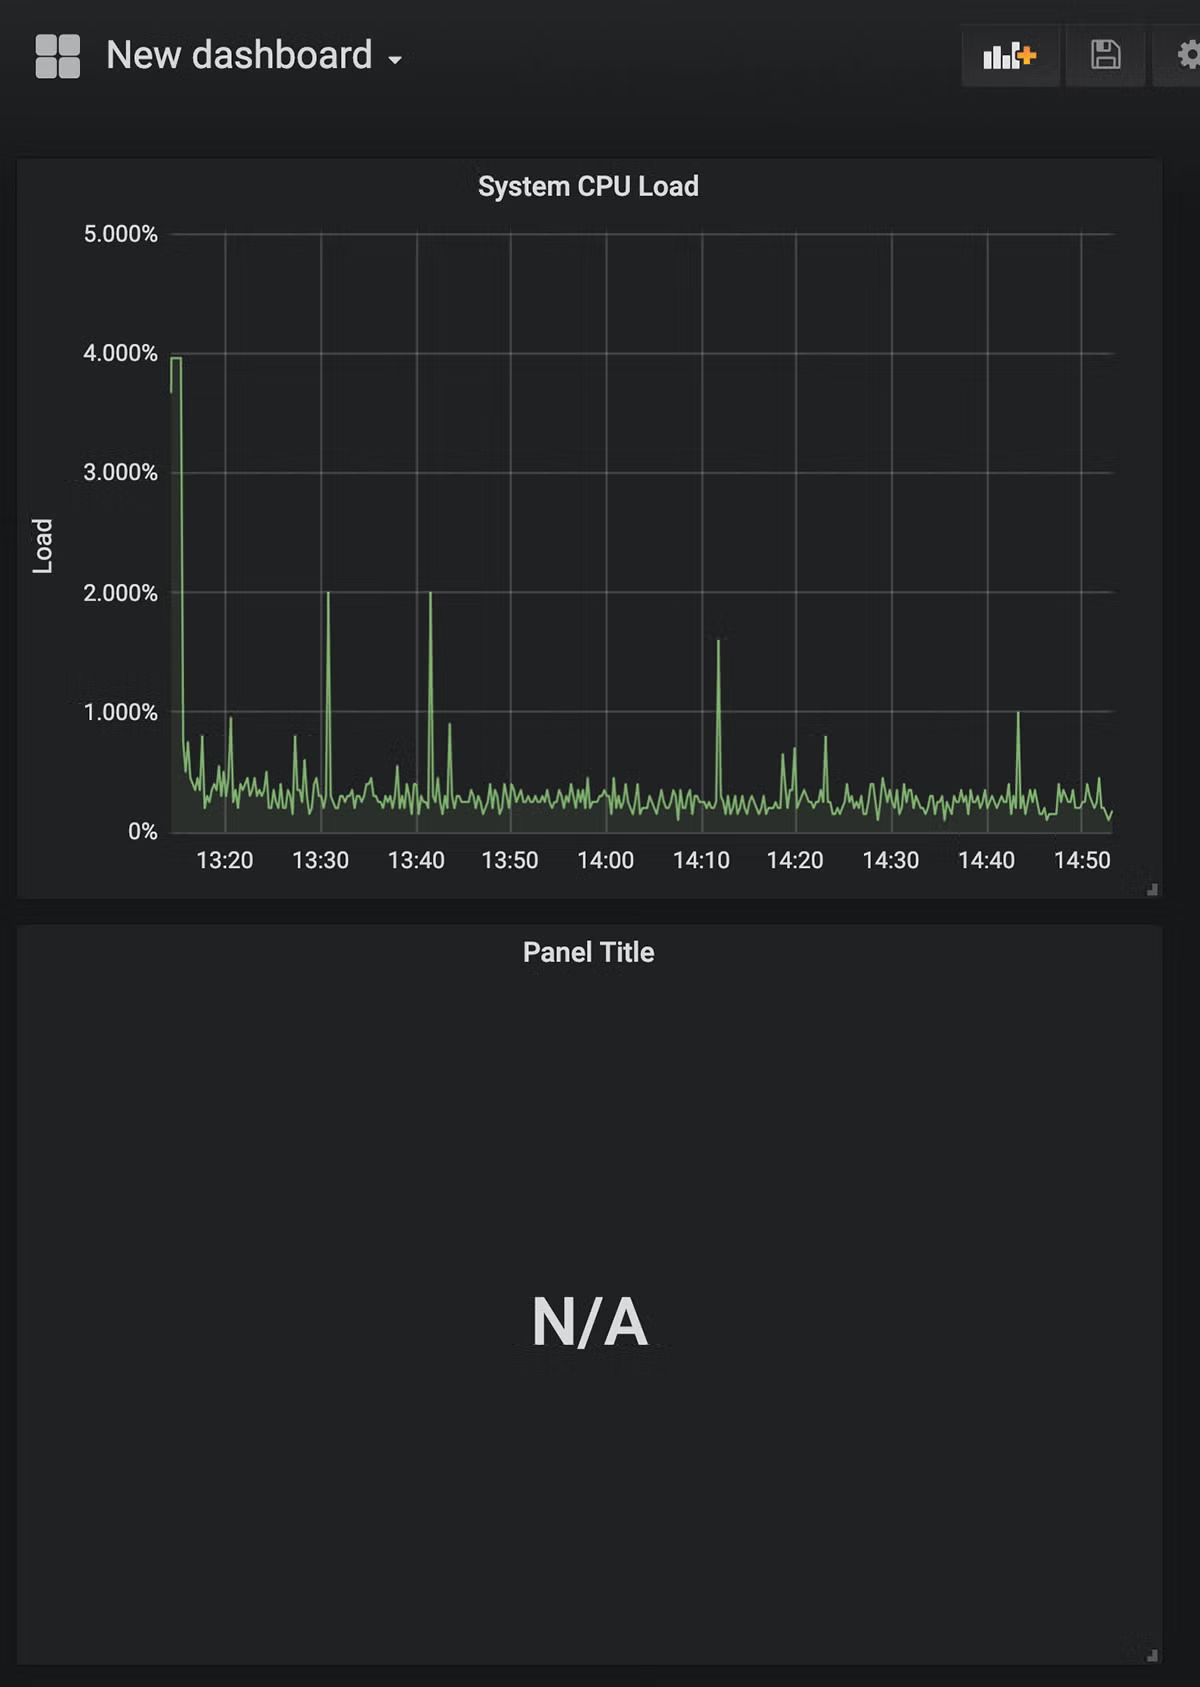
This will bring up our familiar new Panel interface. Choose “Singlestat,” then drag the System CPU Load graph to position it over the new Panel by clicking the title of the Panel and dragging the graph:
Just like in our Graph creation, click the “Panel Title” and edit it, and this time enter the EnqueueCount metric that we grabbed from Prometheus:
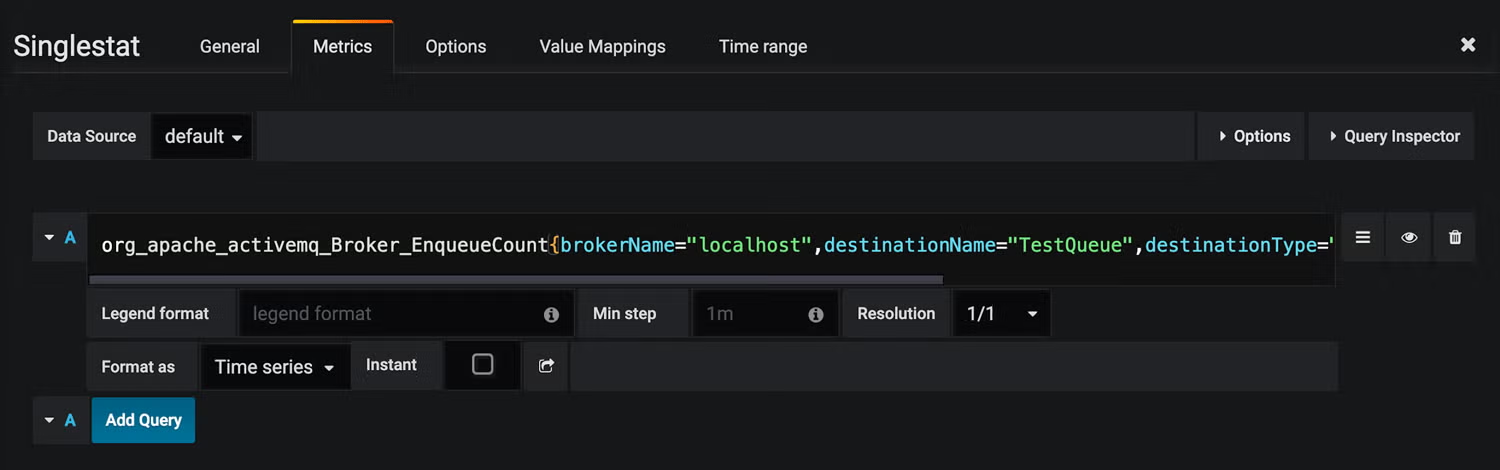
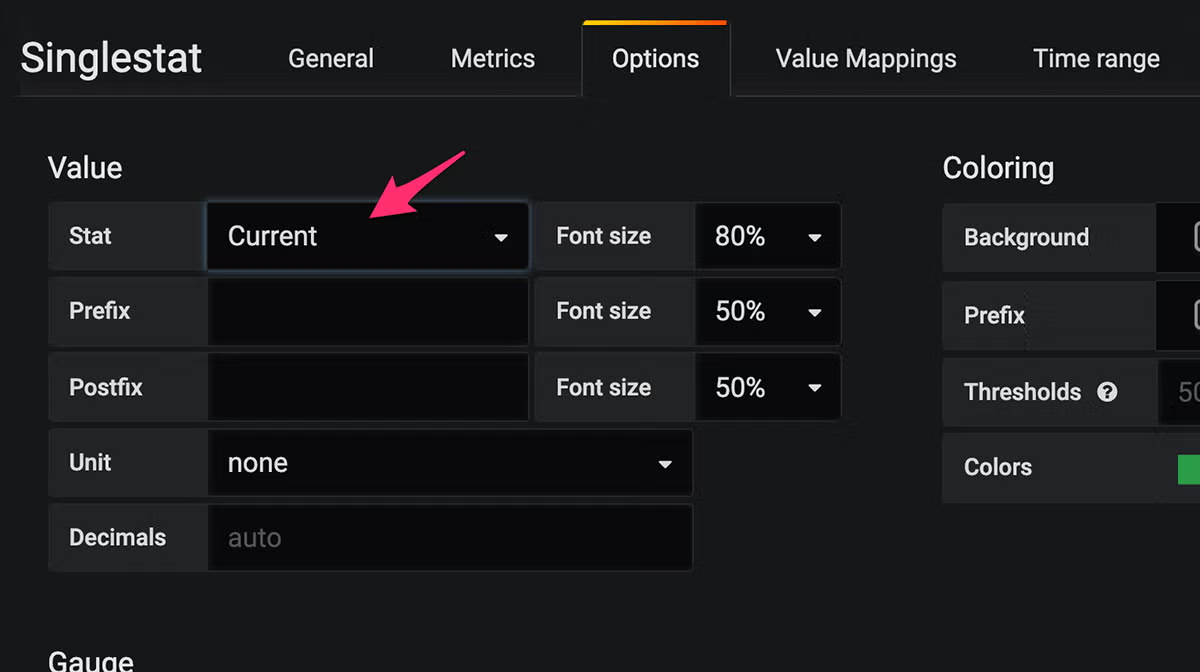
You’ll notice that when you click off, this metric may not match with the value you saw in Prometheus. That’s because the default stat type for a Single Statistic is an Average Value rather than an absolute value. Click the Options tab and choose “Current” for “Stat”:
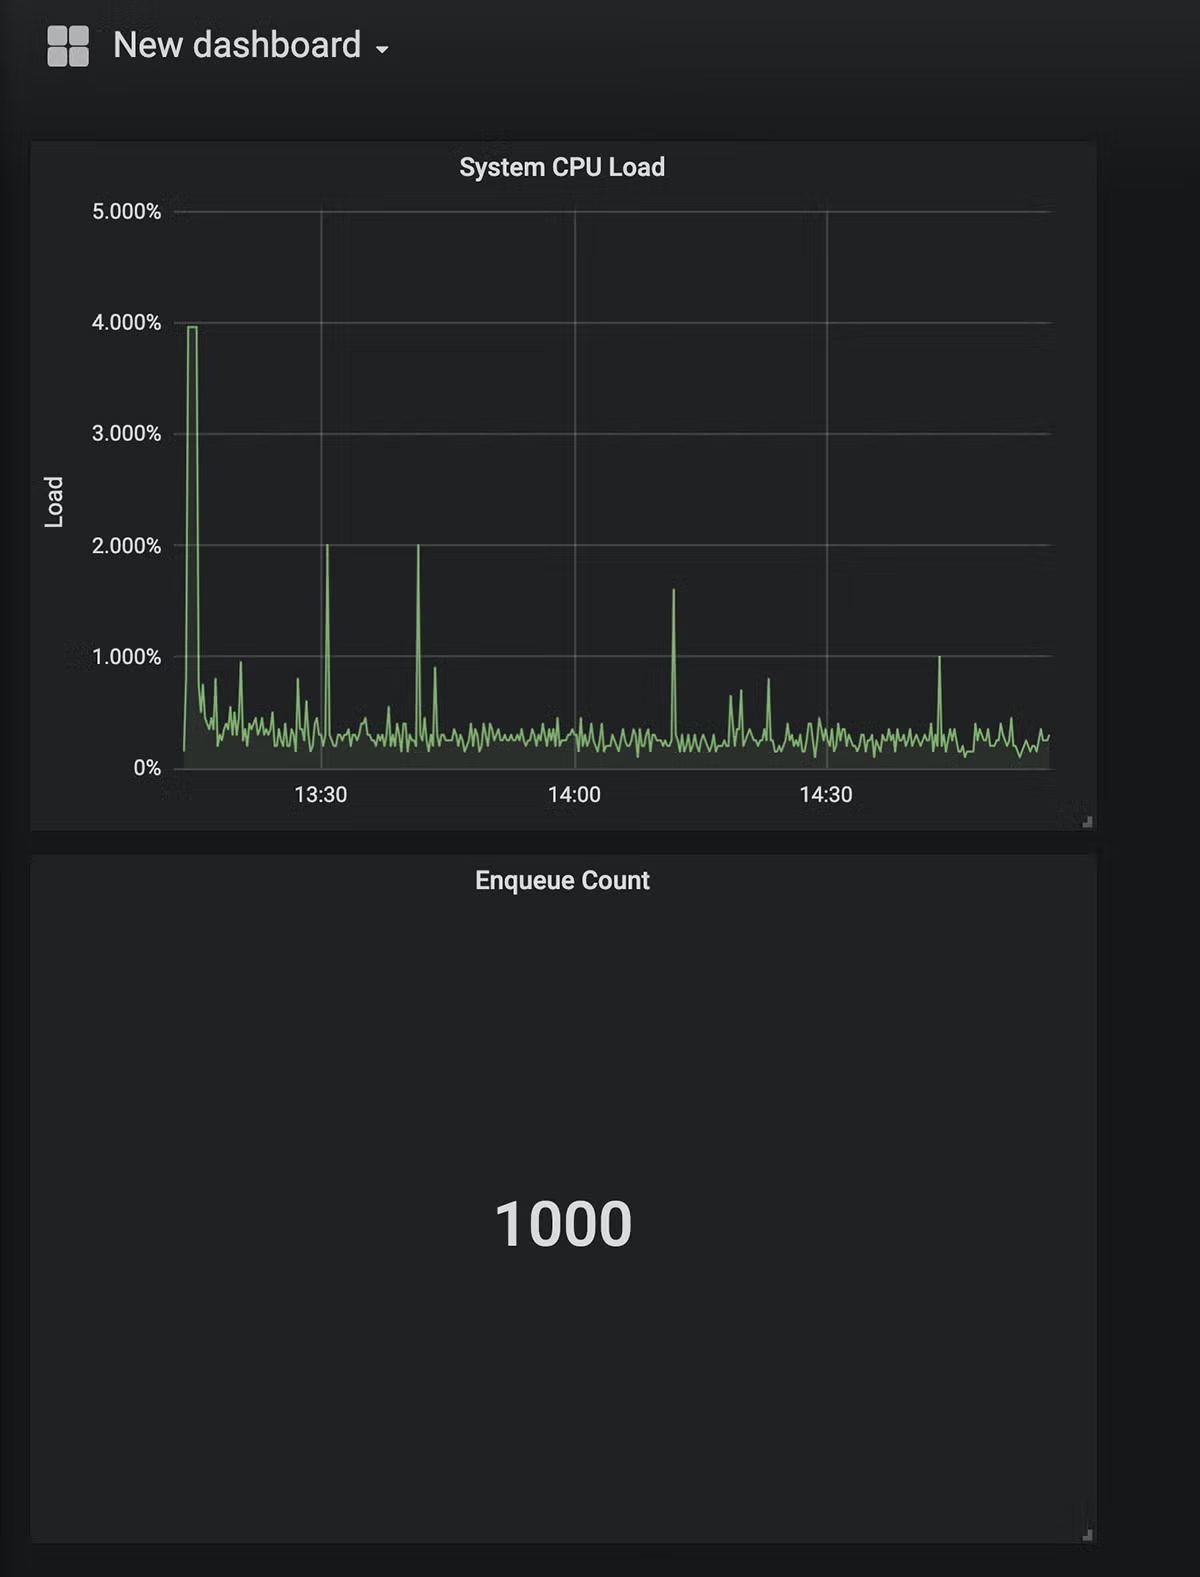
Click “General” and give it a title, and we’re good to go!
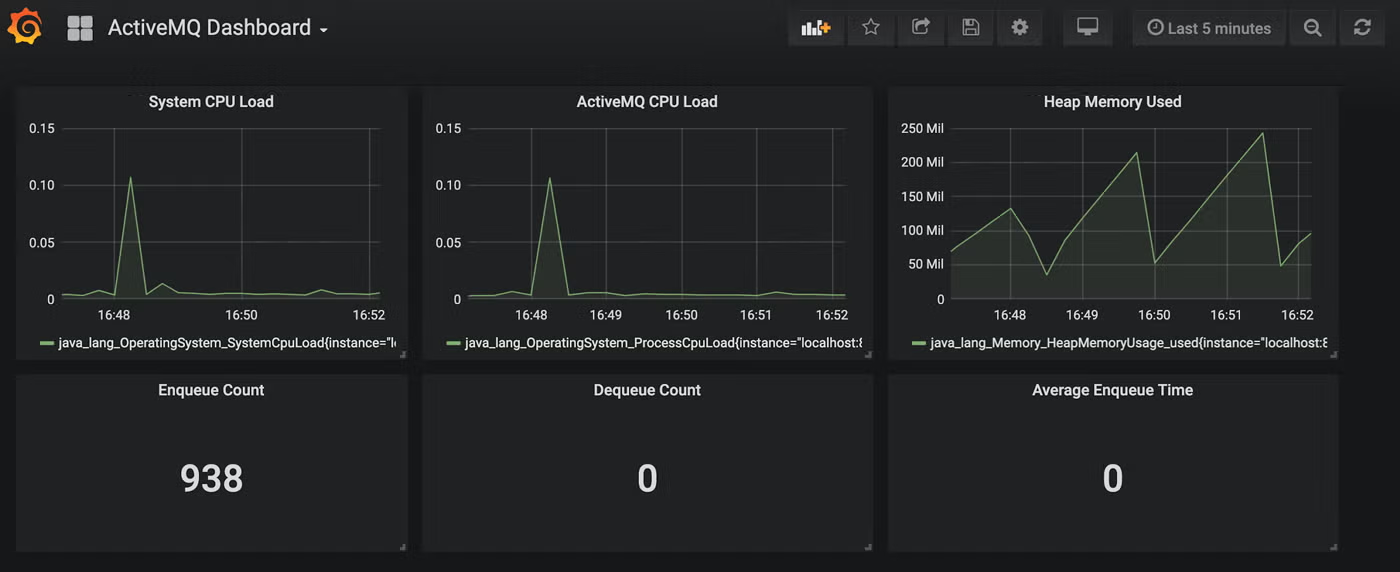
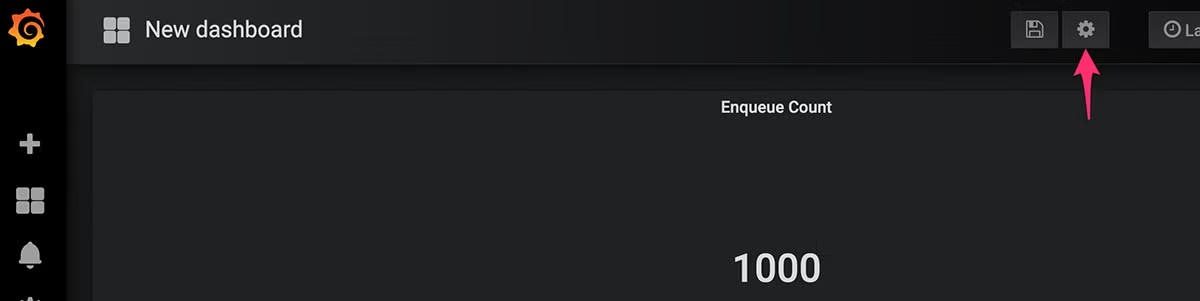
Continue adding and resizing panels and metrics until you’re happy with the final results, then click the Gear Icon to give your Prometheus Grafana dashboard a name:
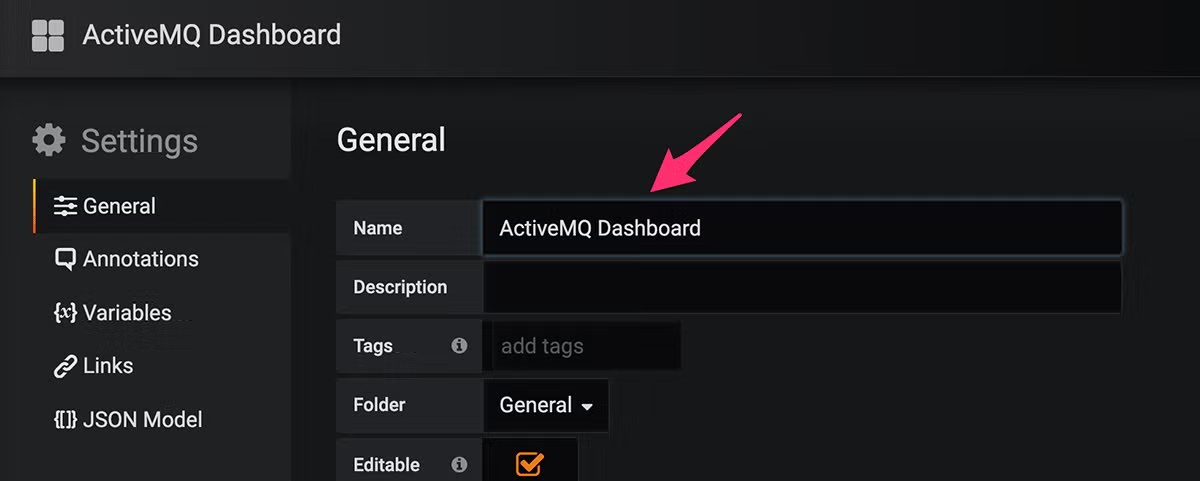
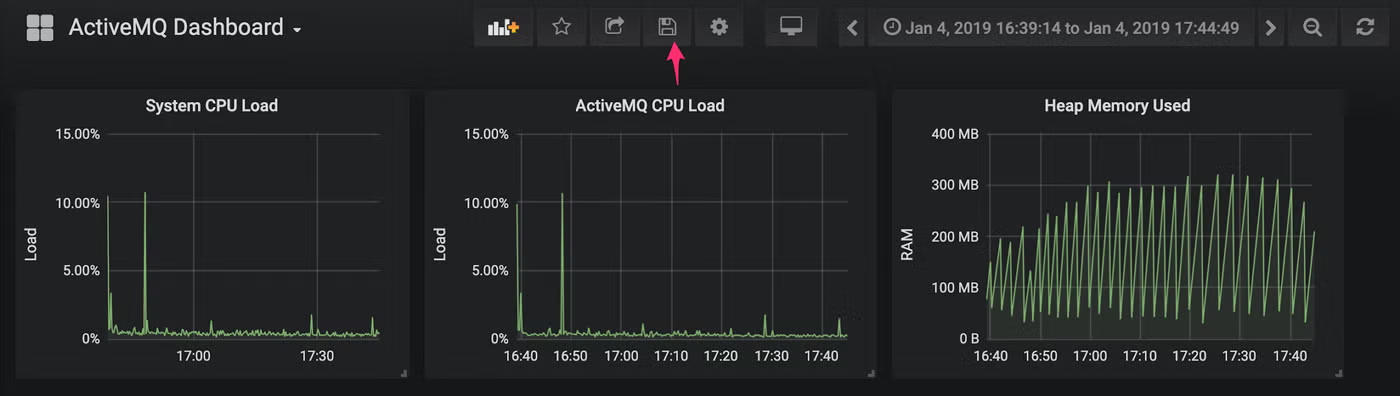
Finally, click the “Save” icon to save your finished product:
4. Enhance Your Prometheus Grafana Dashboard
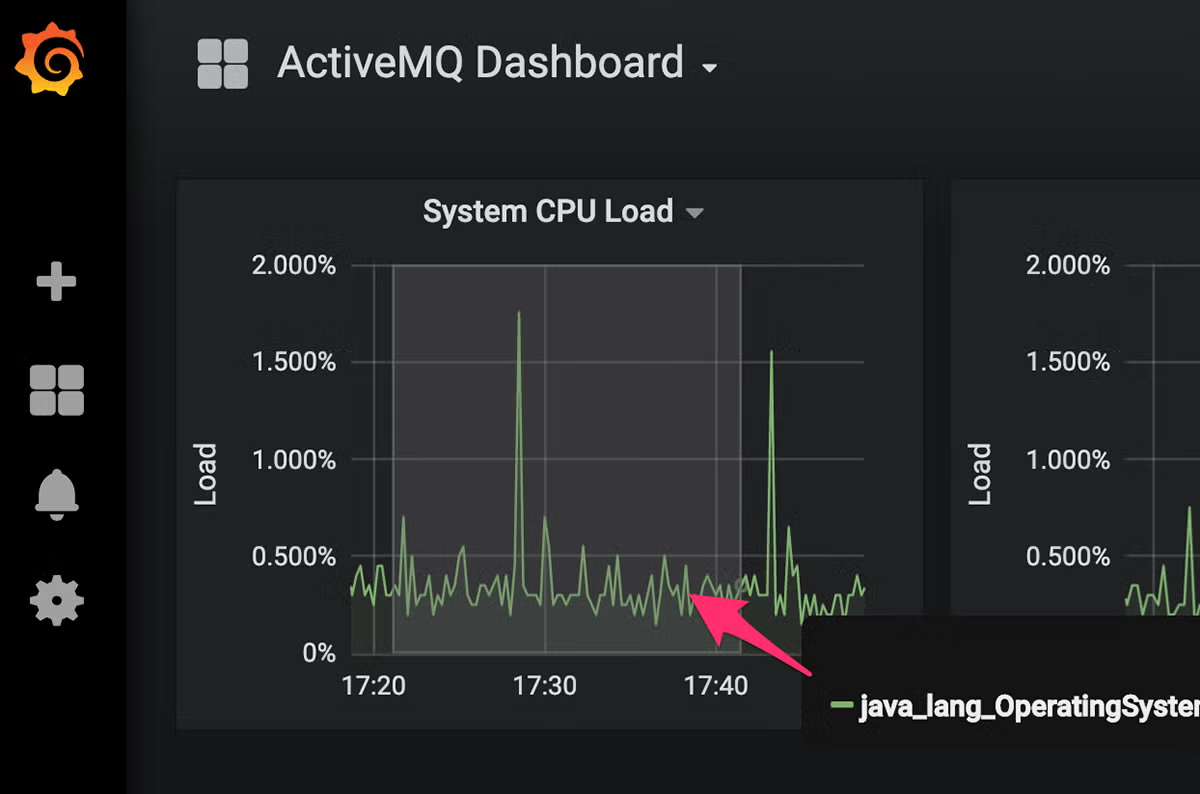
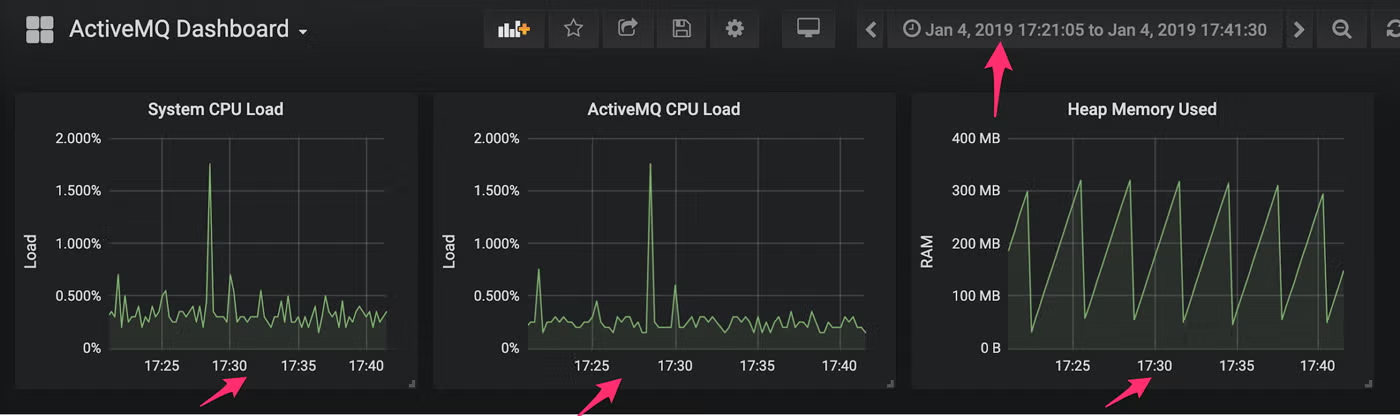
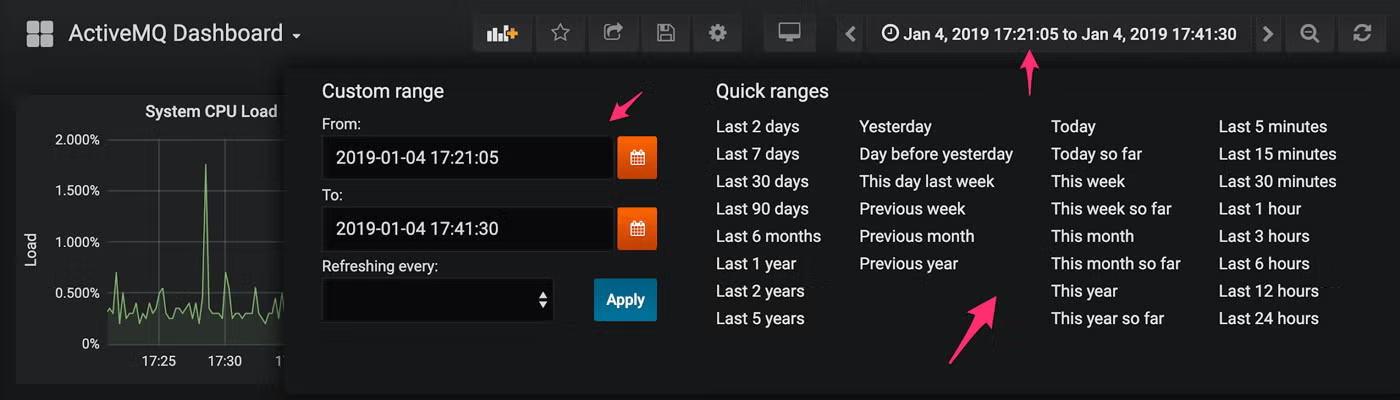
There’s a lot you can do to further enhance your Grafana Prometheus dashboard. You can drill down into a period of time by clicking and dragging on a section of the graph:
Which will update your time range:
And you can click the time range to get a drop-down with various presets, or set a range there:
Back to topGet Support For Prometheus Grafana Dashboard
Our experts are skilled in Prometheus, Grafana, and many other open source analytics solutions. Find out how our open source experts can help you get the most out of your data analytics solutions.
Related Content
- Blog - How to Use Prometheus Monitoring
- Blog - Configuring Grafana Alerts and Prometheus Alerts With AlertManager
- Resource Collection - Intro to Open Source Databases