Blog
February 7, 2019
How to Configure Prometheus AlertManager for Grafana Alerts and Prometheus Alerts

Analytics
Grafana and Prometheus are great for gathering and visualizing data. But do you know how to set up Prometheus AlertManager? In order to truly protect your application and assets, you need a way to notify your teams when something goes wrong.
In this blog, we break down how to configure Prometheus alerts and Grafana alerts using Prometheus AlertManager.
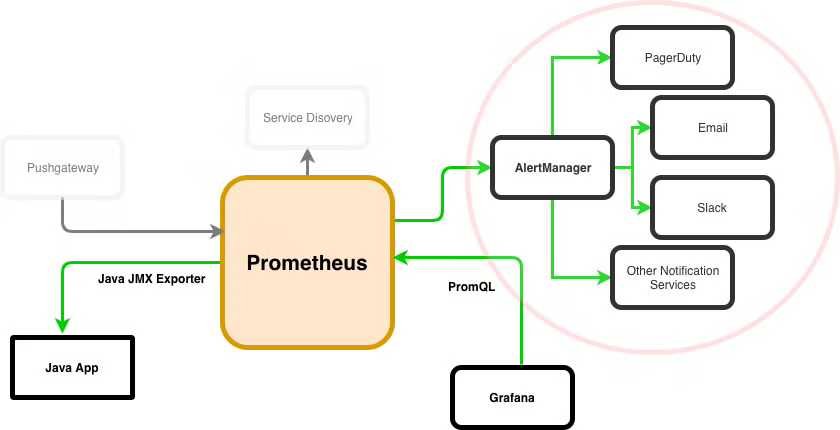
What Is Prometheus AlertManager?
AlertManager is a component of Prometheus. It runs alongside of Prometheus and can integrate with third-party notification tools like PagerDuty.
Can Grafana Send Alerts?
Grafana can send alerts via AlertManager. Keep reading to learn how.
Can Prometheus Send Alerts?
Like Grafana, Prometheus can send alerts via AlertManager. Keep reading to learn how.
Back to topHow to Set Up AlertManager For Prometheus Alerts and Grafana Alerts
Here, we'll show you how to create Grafana alerts and Prometheus alerts by using Prometheus AlertManager:
- Stand up an instance of AlertManager.
- Configure our Prometheus instance to use AlertManager.
- Create alert rules in Prometheus.
- Test Grafana and Prometheus alerts.
So, let’s get to it!
1. Stand Up AlertManager For Prometheus Alerts
AlertManager takes care of handling alerts, grouping them, deduplicating them, and routing them to the appropriate services like email, chat, and PagerDuty. It can also silence and inhibit certain alerts during planned events or downtime.
AlertManager rules are conceptualized as routes, giving you the ability to write sophisticated sets of rules to determine where notifications should end up. A default receiver should be configured for every notification. Then additional services can be configured through child routes that match certain conditions, as such:
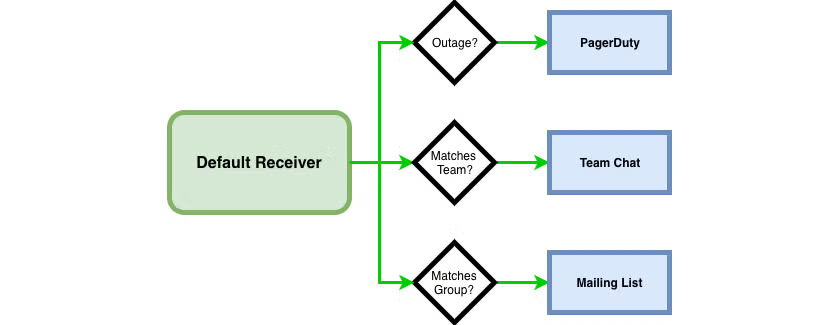
In this example, we have instructed AlertManager to route any notifications classified as an outage to PagerDuty. Further, if the Alert matches a specific team we send it to a chat solution, and if the Alert matches a particular group we send it to a mailing list. We’ll see how to apply these labels to alerts further down when we configure alerts in Prometheus. Note that these matches are not exclusive, and an alert can match multiple conditions with multiple destinations. Until then, to set up AlertManager:
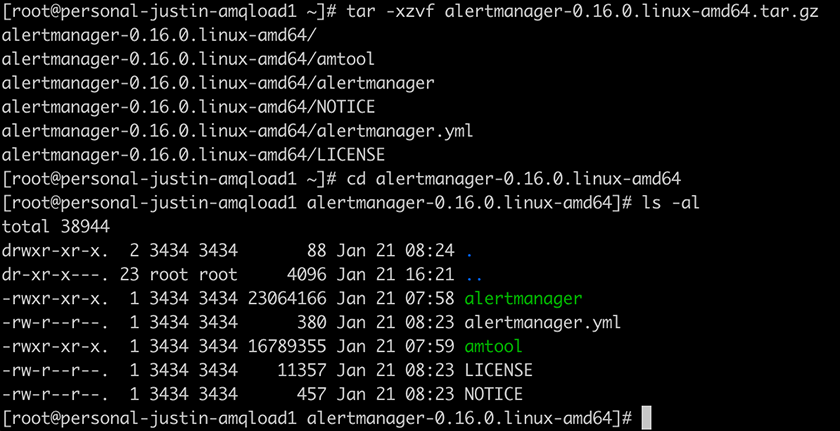
Download the Official Distribution and Unarchive the Bundle
As always, don’t do this as root in production.
Configure AlertManager
The bulk of your configuration will be in a .yml configuration file, similar to how we configured Prometheus. The default configuration that ships in alertmanager.yml is enough to get AlertManager up and running. But it doesn’t contain any integration points with notification services.
Configurations can be simple or complex depending on the number of notification services you integrate with. Here is the full configuration reference.
For this example, we’ll set up an alert receiver in Slack. To do so, we’ll make use of the Slack module for Prometheus, following this documentation.
You’ll need to configure an Incoming Webhook in your Slack instance which is outside the scope of this article, but is well-documented.
Once we have an Incoming Webhook URL from Slack, the rest of the configuration is simple. We create our receiver and use the slack_configs module. Our final configuration (which I’ve placed in a file called demo-config.yml) looks like:
global:
  smtp_smarthost: 'localhost:25'
  smtp_from: 'alertmanager@monitoring.com'

route:
  receiver: 'default-receiver'
  group_wait: 30s
  group_interval: 5m
  repeat_interval: 4h
  group_by: [alertname]
  routes:
  - receiver: 'slack'
    group_wait: 10s
    match_re:
      service: activemq

receivers:
  - name: 'default-receiver'
    email_configs:
    - to: 'justin.reock@roguewave.com'

  - name: 'slack'
    slack_configs:
    - api_url: https://hooks.slack.com/services/...
      channel: '#general'
We first set some global parameters to manage our default behavior, which will be to send an email alert. We start with a “default-receiver” route, which has a corresponding “receivers” section configuring the inbox of our alert. We then start a child route to a receiver called ‘slack’ that will be invoked if the “service” label on the alert regex matches to “activemq.”
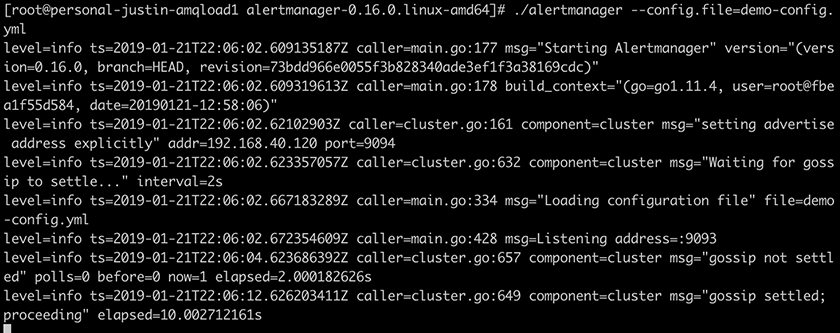
Fire Up AlertManager
Next, you can fire up AlertManager with:
./alertmanager --config.file=demo-config.yml
That’s it! If AlertManager starts successfully, you should see output similar to the following:
Now we’ll need to head over to Prometheus and attach it to our new AlertManager instance.
2. Integrate Prometheus with AlertManager
This part is pretty easy. We just need to modify our existing Prometheus yaml configuration and let Prometheus know that we have an AlertManager instance ready to go. We will be statically configuring. But there are discovery mechanisms available as well. We’ll add a new section to the config called “alerting” and create a static_configs table for our AlertManager instance.
The final configuration file will look like:
global:
  scrape_interval:     15s
  external_labels:
    monitor: 'activemq'

rule_files:
  - ./rules-amq.yml

scrape_configs:
  - job_name: 'activemq'
    scrape_interval: 5s
    static_configs:
      - targets: ['localhost:8080']

alerting:
  alertmanagers:
    - scheme: http
      static_configs:
        - targets: ['localhost:9093']
In this config, then, we are creating an alertmanagers config, and pointing to the instance of AlertManager we have running locally in this demo. You might have also noticed a new entry for rule_files. This is where we configure our actual thresholds and alerts.
3. Configure Prometheus Alerts
Now that we have Prometheus integrated with AlertManager, we will need to configure some rules. Prometheus gives you a great deal of functionality and flexibility to create your alert conditions.
Here, we’ll just be looking at two metrics within our ActiveMQ instance.
- We’ll first check to make sure the broker is actually up.
- Then we’ll check to see if any messages have entered the Dead Letter Queue, which is a standard place for failed messages to go in a JMS provider like ActiveMQ.
Let’s get cracking!
Set Up the First Metric
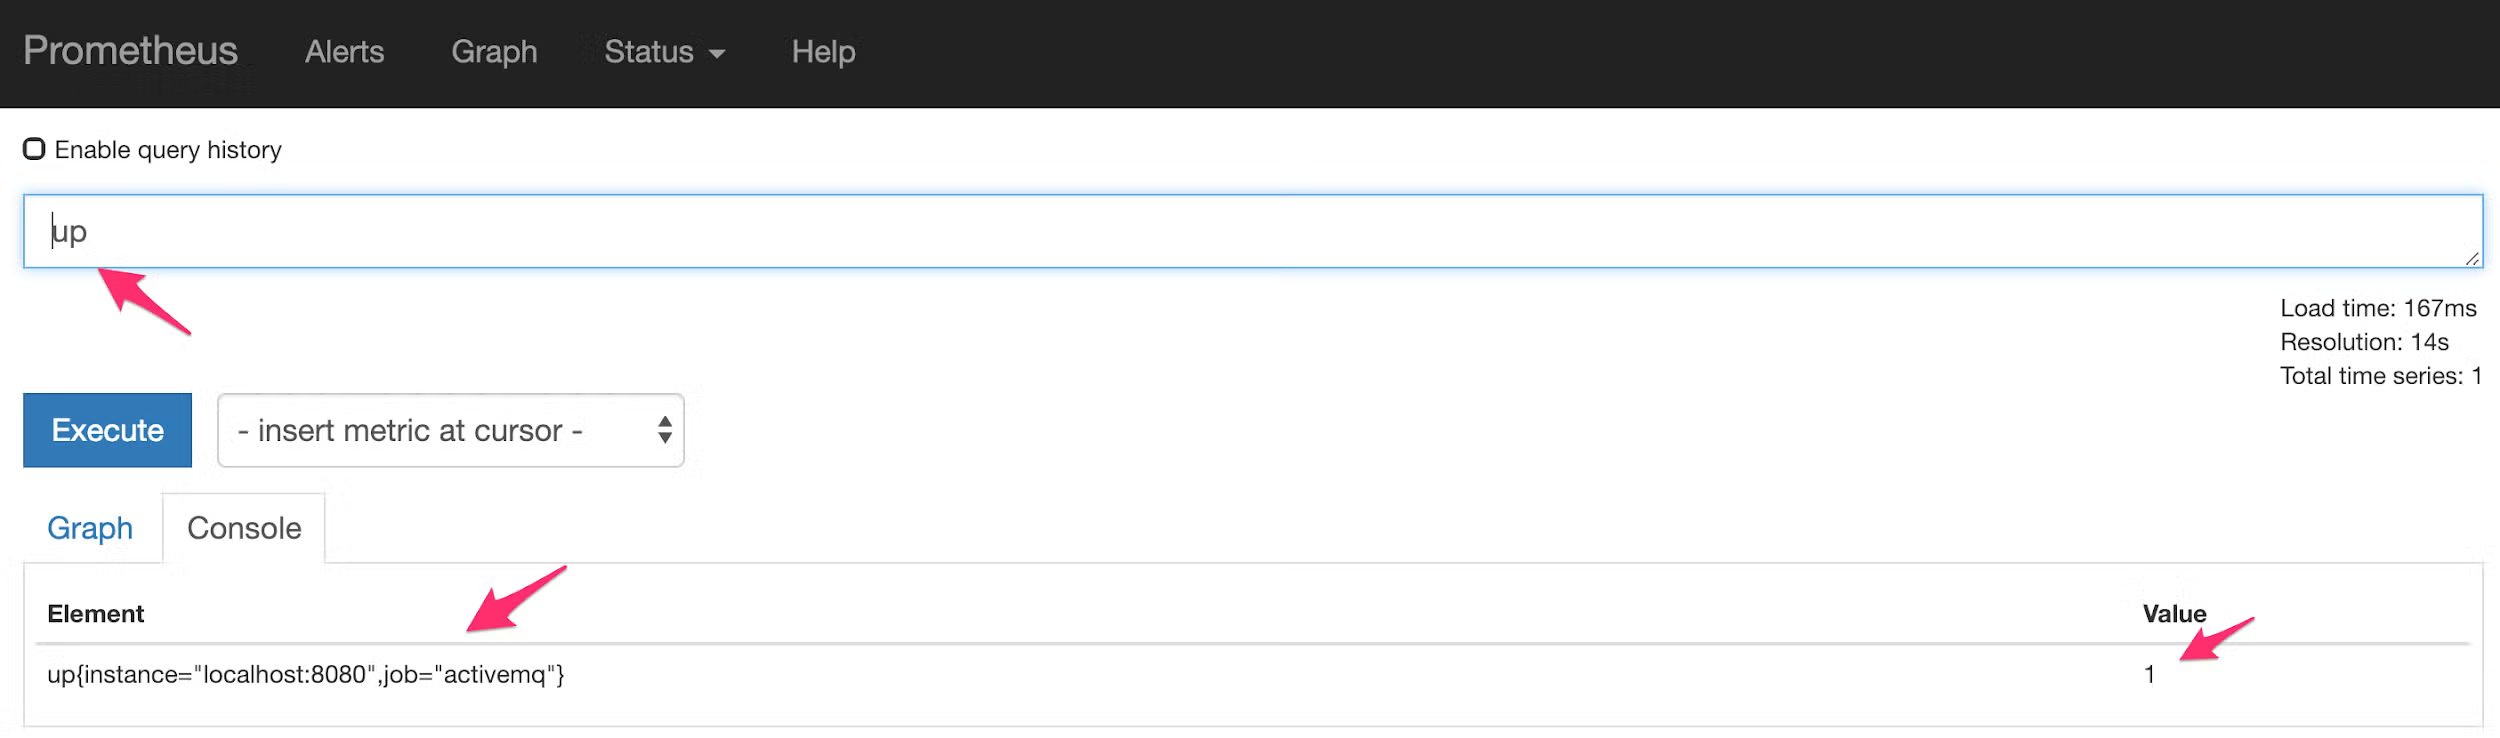
The first metric is a generic metric used by Prometheus to indicate whether it was able to scrape metrics. It is simply called “up” and carries a value of 1 for “up” and 0 for “down”:
So in our new rules-amq.yml file, we can add an entry to catch when this metric equals “0” and react appropriately. Rule files use a top-level “groups” entry, and then are split into any number of groups. We’ll look at the whole configuration file in a moment, but for this rule specifically we will create the following configuration:
  - alert: Broker Down
    expr: up{job="activemq"} == 0
    labels:
       severity: major
       service: activemq
    annotations:
       summary: The broker has crashed
       dashboard: http://192.168.40.120:3000/dashboard/db/activemq-broker
       impact: Broker is down
       runbook:  http://activemq.apache.org
In this section, we have a few things going on. First, the “- alert:” tag simply gives the alert a friendly name. We’ve specified “Broker Down.” The “expr” section is where you craft your rules, and you can perform pretty sophisticated comparisons in here.
In this case, we’re simply specifying that we’ll trigger this alert if the “up” metric for the “activemq” job is ever 0. We can then create labels and annotations, including a link to our Grafana dashboard under the “dashboard” param, and even an internal runbook for the service!
Set Up the Next Metric
Our next metric will concern the depth of the DLQ, so we can use the org_apache_activemq_Broker_DLQ metric, which is a JMX Metric being scraped that contains the depth of the ActiveMQ DLQ. We’ll do a comparison operator to make sure that the metric isn’t above 0:
  - alert: DLQ
    expr: org_apache_activemq_Broker_DLQ > 0
    for: 1m
    labels:
       severity: minor
       service: activemq
    annotations:
       summary: A message has gone into the DLQ
       dashboard: http://192.168.40.120:3000/dashboard/db/activemq-broker
       impact: A message has been misfired
       runbook:  http://activemq.apache.org
Note: We added the “for” parameter here, which means that this condition must be true for 1 minute before an alert will fire. This can help cut down on unnecessary alerts for conditions which may be self-healing.
That’s it — our complete configuration should look like:
groups:
- name: activemq
  rules:
  - alert: DLQ
    expr: org_apache_activemq_Broker_DLQ > 1
    for: 1m
    labels:
       severity: minor
       service: activemq
    annotations:
       summary: A message has gone into the DLQ
       dashboard: http://192.168.40.120:3000/dashboard/db/activemq-broker
       impact: A message has been misfired
       runbook:  http://activemq.apache.org
  - alert: Broker Down
    expr: up{job="activemq"} == 0
    labels:
       severity: major
       service: activemq
    annotations:
       summary: The broker has crashed
       dashboard: http://192.168.40.120:3000/dashboard/db/activemq-broker
       impact: Broker is down
       runbook:  http://activemq.apache.org
Save the Configuration
Save that configuration into the rules-amq.yml file that we are now referencing, and fire up Prometheus in the normal manner:
./prometheus --config.file=./prom-amq-alerts.yml
That’s it for our configuration, let’s test it all out!
4. Testing Prometheus Alerts and Grafana Alerts
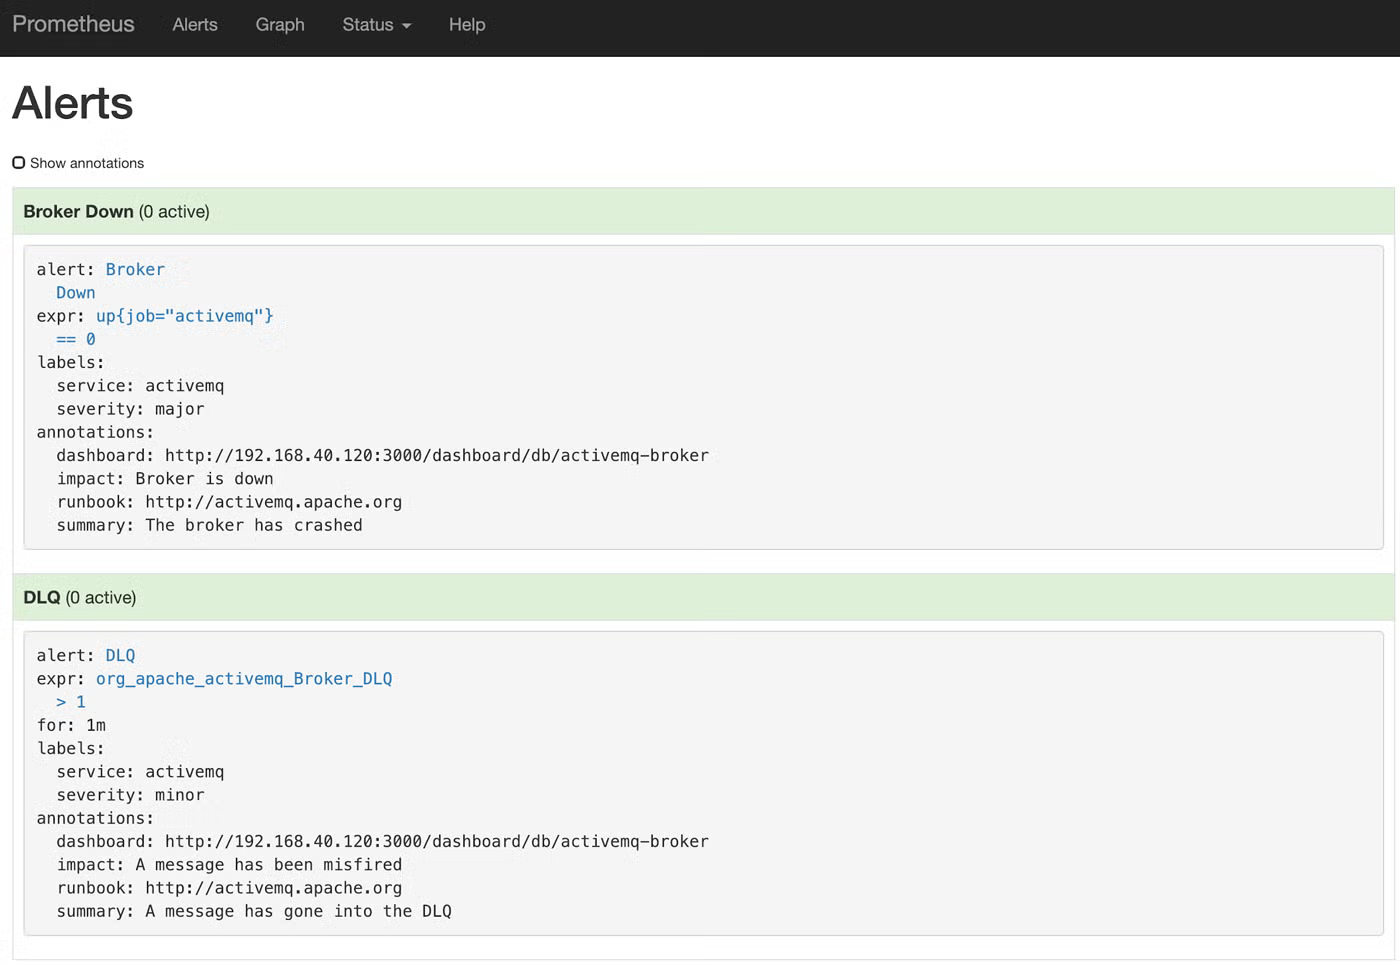
First, let’s make sure that Prometheus has accepted our alert configuration. Open it up in a browser and click “Alerts.” In here you should see the two alerts we just configured:
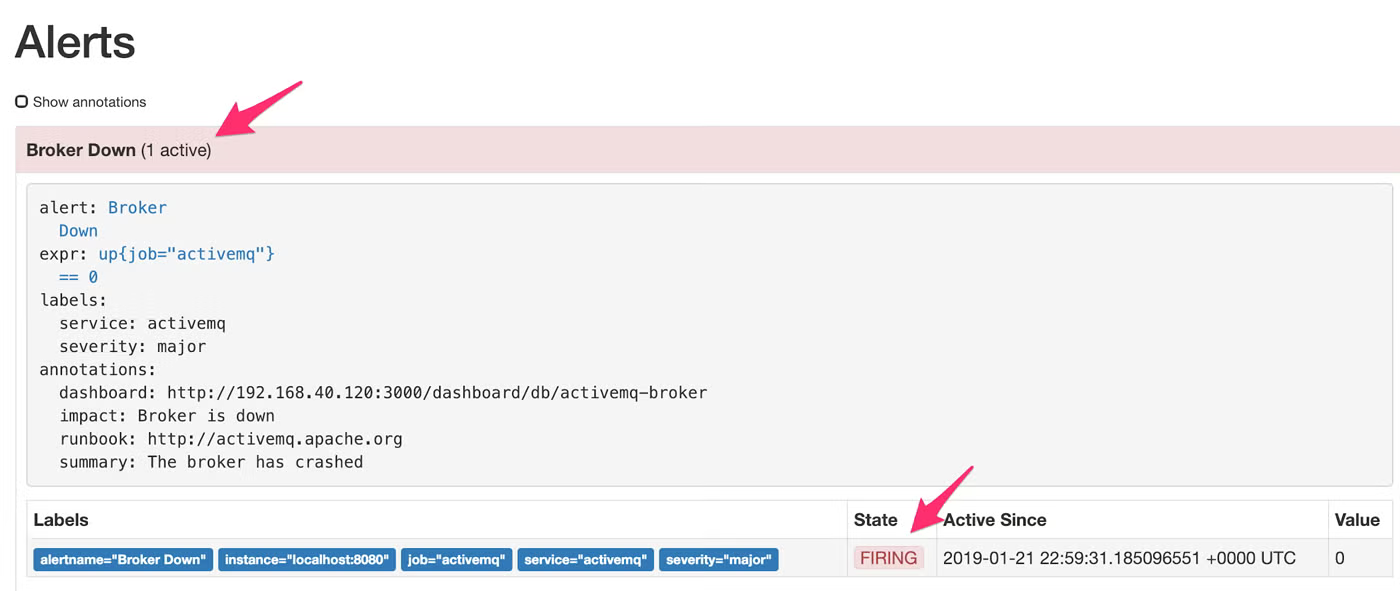
Looks great! Let’s make an alert fire by bringing down our ActiveMQ broker process. Once it’s down, it could take up to 30 seconds for Prometheus to notice, since that is what our scrape settings are limited to. But once it does notice, you’ll see that the Alert has been fired:
And we should see our Alert in Slack!

Of course, this is pretty bare-bones, but you can reference the slack_configs configuration guide linked above to learn how to further customize the alert, including custom graphics, emojis, and of course text.
Need Help with Prometheus?
OpenLogic's unbiased open source experts are here to provide technical support and professional services.
Additional Resources
- Blog - How to Use Prometheus Monitoring
- Resource Collection - Intro to Open Source Databases