Blog
March 31, 2026

Each year, the State of Open Source Report offers a snapshot of how organizations around the world are using, supporting, and investing in open source software. As adoption continues to mature, the focus is shifting from whether to use open source to how to manage it sustainably.
Based on insights from the 2026 State of Open Source Report (produced in collaboration with the Open Source Initiative and the Eclipse Foundation), this blog highlights the most significant trends shaping enterprise open source today — from vendor lock‑in concerns and maintenance burden to security, compliance, and open source maturity.
Read the Full Report
Back to top
OSS Adoption Is Near Saturation, But Still Growing Strategically
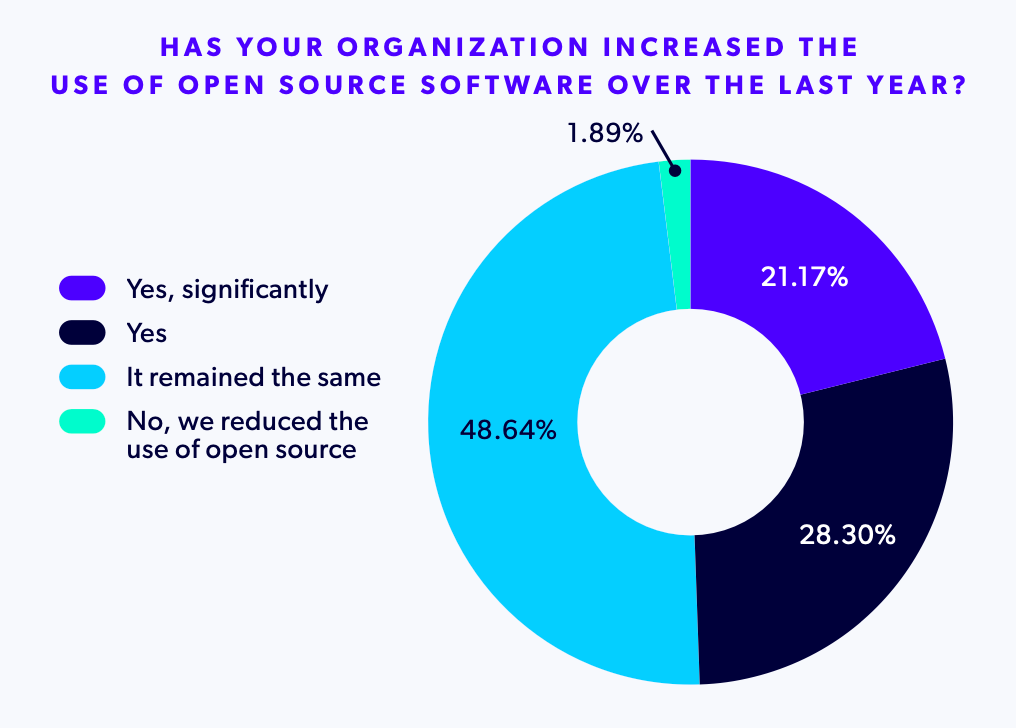
Open source software continues to be foundational to modern IT environments. In the last 12 months, 98% of organizations increased or maintained their use of OSS, with nearly half reporting year-over-year growth.
What’s notable this year is not raw adoption, but maturity. The percentage of organizations reporting unchanged usage reached its highest point yet, suggesting that for many teams, OSS is no longer a growth initiative — it’s a given. Adoption has stabilized, but investment priorities and governance models continue to evolve.
Vendor Lock-In Concern Has Become a Top Driver
Reducing license and overall costs remains the leading reason organizations choose OSS. However, avoiding vendor lock‑in surged by 22 percentage points compared to 2025, cited by 55% of respondents — a 68% year‑over‑year increase.
This concern is especially pronounced in Europe and the UK, where nearly two‑thirds of organizations now cite vendor lock‑in as a primary motivator. Write‑in responses increasingly reference data sovereignty and digital autonomy, reflecting growing regulatory and geopolitical pressures on software supply chains and sourcing decisions.
Back to topLast year, one-third (33%) of respondents cited vendor lock-in avoidance as a reason for choosing OSS, but this year, more than half (55%) selected it. In Europe, 63% are concerned about it, compared to 51% in North America.
Maintenance Is Crowding Out Innovation for Large Enterprises
While building new features remains the top development priority, the margin is slim. Survey responses show near‑equal weighting across the software development lifecycle, from security to deployment automation.
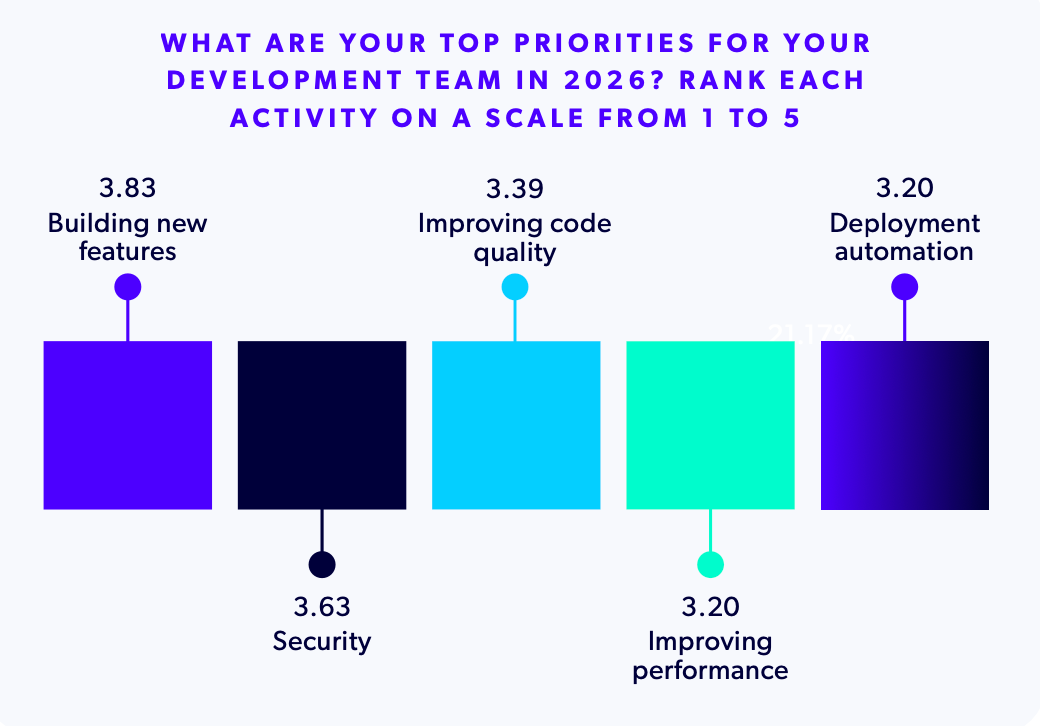
The bigger issue is time allocation:
- Nearly half of all respondents spend 50% or more of their time on maintenance and bug fixes instead of feature development
- 60% of large enterprises report the same imbalance
- Among enterprise Java teams, almost a third spend 75–90% of their time maintaining existing systemSee more Java trends from the report
These findings highlight a growing tension: OSS enables flexibility and autonomy, but without adequate support and lifecycle planning, it can also hinder development velocity.
Video
Perforce, OSI, and Eclipse Foundation Leaders Discuss the Report
Watch a panel discussion featuring Matthew Weier O'Phinney (Principal Product Manager, Perforce OpenLogic), Duane O'Brien (Executive Director, Open Source Initiative), and Gaël Blondelle (VP Community Operations, Eclipse Foundation).
Security and Vulnerability Management Remain Pain Points
Security updates and patching once again rank as the most challenging aspect of using open source, regardless of organization size.
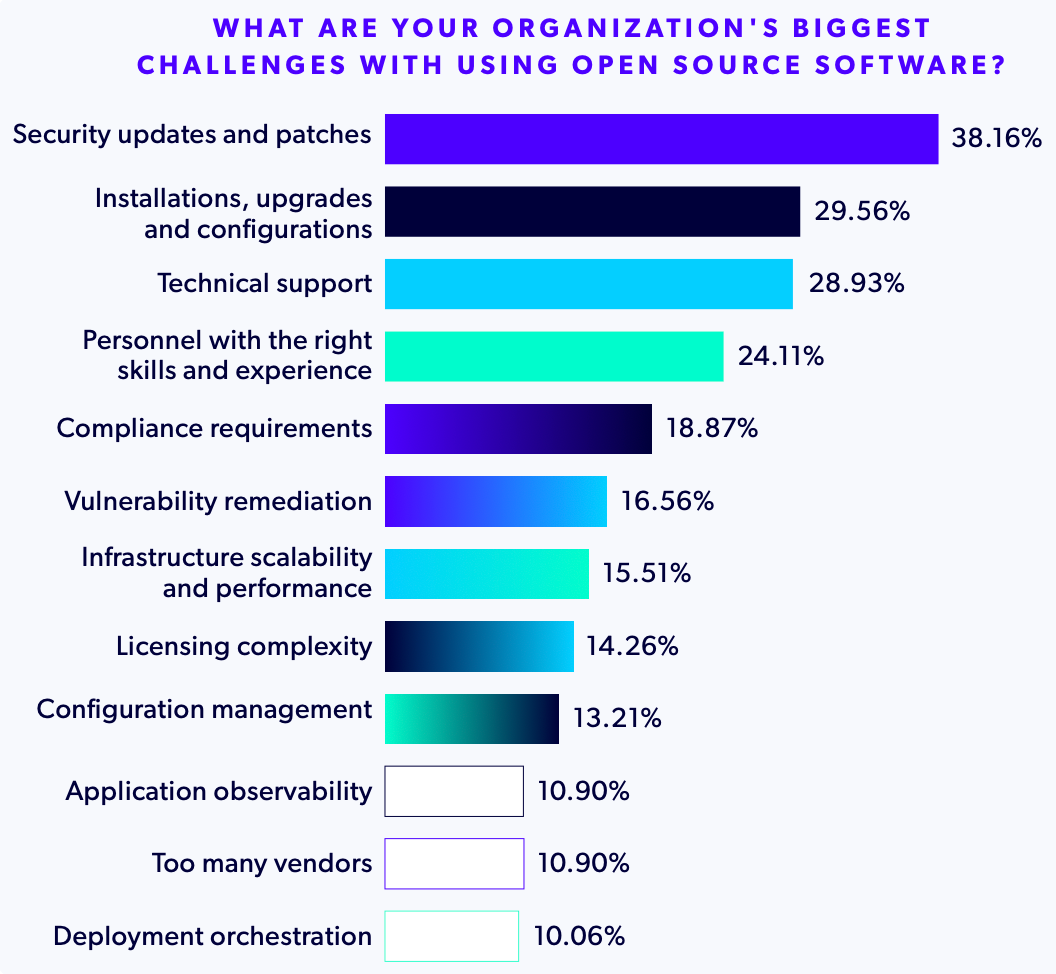
Key findings include:
- 20% of organizations have no formal process for addressing CVEs
- 39% of large enterprises struggle to meet internal SLAs for vulnerability remediation
- After software reaches end of life, most organizations lack the internal capability to patch it themselves
Back to topThe data reinforces a familiar theme: staying secure is less about tooling and more about process, resourcing, and version discipline.
EOL and Legacy Software Drive Up Risk of Audit Failure
Only 8% of organizations failed a compliance audit in the past year — but those that did share common traits:
- 55% were running end‑of‑life (EOL) software
- Audit failure rates were twice as high for organizations using legacy versions of Tomcat, Spring Boot, and Spring Framework
With new EU compliance regulations such as DORA now in effect, the cost of running unsupported software is no longer theoretical. Compliance, security, and operational resilience are increasingly intertwined.
Back to topOpen Source Maturity Is Improving
Encouragingly, the report shows steady progress in OSS governance and participation:
- 40% of organizations contribute to open source projects
- 30% develop open source software in public repositories
- SBOM generation among large enterprises rose to nearly 39%, continuing a multi‑year upward trend
That said, formal structures like Open Source Program Offices (OSPOs) and compliance roadmaps remain far from universal, particularly outside of large enterprises.
Back to topFinal Thoughts
The 2026 State of Open Source Report data makes one thing clear: open source is no longer just a cost‑saving tactic — it’s critical infrastructure. Organizations are leaning on OSS to reduce dependency on proprietary vendors, meet evolving regulatory demands, and retain strategic control over their software stacks.
But as adoption matures, the challenges shift. Maintenance overhead, security gaps, and legacy components are now the primary constraints. The organizations best positioned for long‑term success are those treating open source as something to actively support and govern, not just consume.
Additional Resources
- Blog - The Path to Digital Autonomy With Open Source
- Free Consultation - Digital Autonomy Readiness Assessment
- Blog - State of Open Source Report: Top Open Source Databases and Data Technologies
- Press Release - 2026 State of Open Source Report
- Archive - Previous State of Open Source Reports
- Blog - Open Source Trends and Predictions for 2026
- Blog - 5 Reasons Why Companies Choose OpenLogic for OSS Support
One Vendor, 400+ Open Source Technologies
OpenLogic is the only OSS support provider that can support everything in your stack. We provide SLA-backed enterprise support up to 24/7, LTS, and professional services including migrations and consultations. Get started by clicking the button below.